

Originally posted by Barnaby
View Post
It is the ones that come into the area from somewhat far afield, and who then radiate from some sort of anchor that keep us all guessing.
Originally posted by The Good Michael
View Post
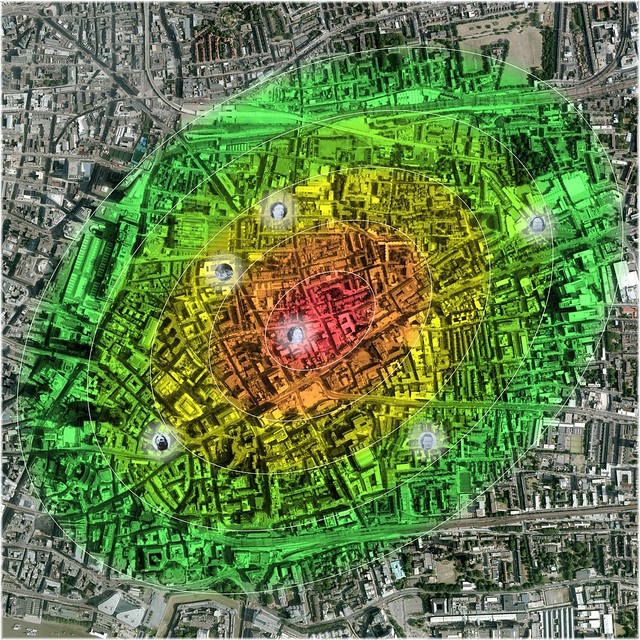
Accumulation of Probability Distribution (Elliptical): Murder-Site Mean-Center, to Extent of Fifty Percent Accumulation (Click Image, to Enlarge in flickr)
Underlying Aerial Imagery: Copyright Google Earth, 2010
Overlying Plots, Labels and Color-Shadings: Copyright Colin C. Roberts, 2011[/QUOTE]
50%
The model would therefore suggest that 'Jack the Ripper' was just as likely to have lived within the area that is color-shaded by the outer green isopleth as he was to have lived within the area that is color-shaded by the inner red isopleth. But as the inner red isopleth is much smaller, the model would suggest that a particular dwelling that was situated therein would have been a more likely place of residence for our perpetrator than would a particular dwelling that was situated within the outer green isopleth.
Put simply: the suggested probabilities are the same for each of the color-shaded isopleths, but the suggested probability densities are greatest in the center.
Put more simply (I hope): the total volume of rainfall is the same in each of the color-shaded regions, but the concentration of rainfall is greatest in the center.
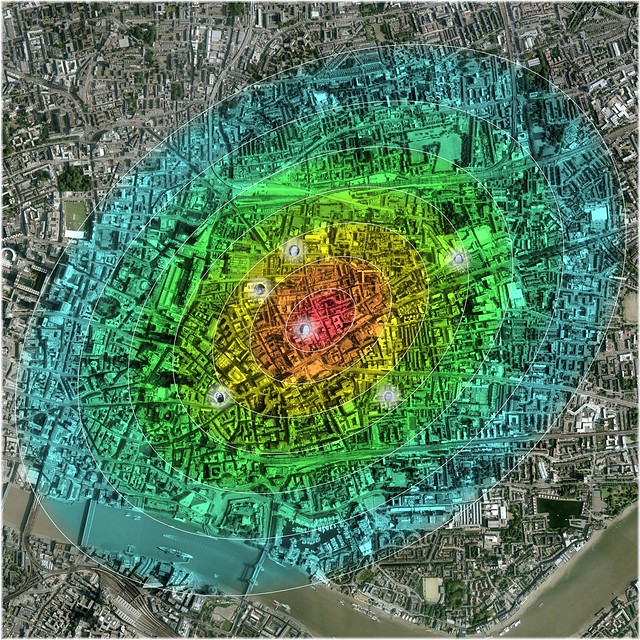
Accumulation of Probability Distribution (Elliptical): Murder-Site Mean-Center, to Extent of Seventy Percent Accumulation (Click Image, to Enlarge in flickr)
Underlying Aerial Imagery: Copyright Google Earth, 2010
Overlying Plots, Labels and Color-Shadings: Copyright Colin C. Roberts, 2011
70%

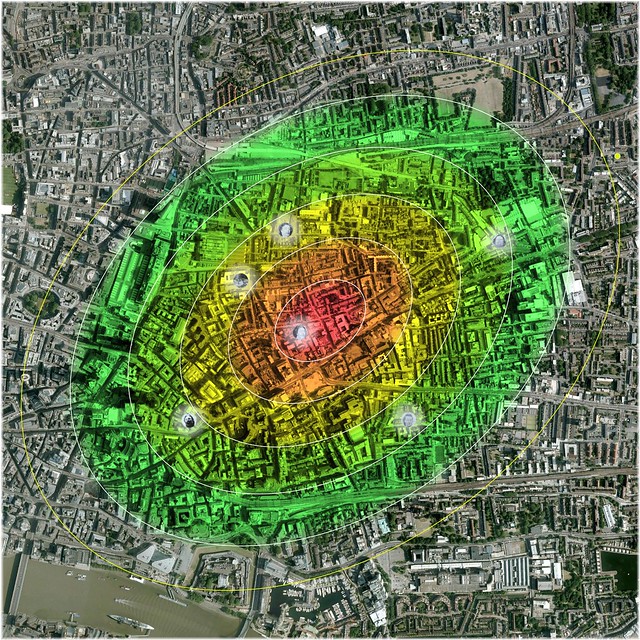
Accumulation of Probability Distribution (Elliptical): Murder-Site Mean-Center, to Extent of Ninety Percent Accumulation (Click Image, to Enlarge in flickr)
Underlying Aerial Imagery: Copyright Google Earth, 2010
Overlying Plots, Labels and Color-Shadings: Copyright Colin C. Roberts, 2011
90%
Accumulation of Probability Distribution (Elliptical): Murder-Site Mean-Center, to Extent of Fifty Percent Accumulation [Plus Contour Depiction of Extent of Two Standard Deviations from Murder-Site Mean-Center (Yellow)] (Click Image, to Enlarge in flickr)
Underlying Aerial Imagery: Copyright Google Earth, 2010
Overlying Plots, Labels and Color-Shadings: Copyright Colin C. Roberts, 2011
Yellow Contour: The extent of two standard deviations from the murder-site mean-center
Yellow Dot: The 1888 residence of Charles Lechmere; 22 Doveton Street, Hamlet of Mile End Old Town
Lechmere's 1888 residence would fall just within the 58th-60th percentile of the overall probability distribution.
That said: It would be foolhardy to write him off on the basis of geography; especially when considering the fact that he traversed the major axis of the observed killing field as a matter of daily routine.
I must now excuse myself from the discussion.
Thank You All & Good Luck!


Leave a comment: