Announcement

Collapse
No announcement yet.

Laura Richards knows who the ripper was

Collapse
X
 
  • Filter
  • Time
  • Show
Clear All
new posts

  • #46
    Originally posted by Trevor Marriott View Post
    The fact is as Caz suggest there was nothing more than a 50/50 chance that the killer either came from Whitechapel or from outside Whitechapel.
    Hang on Trev, old sport. I did not 'suggest' anything. I was attempting to clarify precisely what Colin was saying, because although I was cracking at 'sums' when at school, and got an A in my maths O level a year early, and even did a bit of calculus in my time, I have always struggled with odds and probability and how statistics may or may not be interpreted.

    I will leave it to Colin to tell me what's what when he returns. I went cold this morning, suddenly thinking I'd got the 50/50 thing completely wrong. But there do seem to be only the two horses in Colin's field, "Tiny Inside" and "Vast Outside", which is why I thought that if it's evens for one it would have to be evens for t'other, and not a million to one or anything. But I may be talking bollocks. (Yeah, I know, wouldn't be the first time.)

    Ouch, my brain hurts again.

    Love,

    Caz
    X
    "Comedy is simply a funny way of being serious." Peter Ustinov


    Comment


    • #47
      Thoroughfares

      The murder sites could be close to thoroughfares because that’s probably where the prostitutes were practising their work. I mean, today they’re gathering at streets where’s enough traffic at night and not at some dark and empty back alleys – shouldn’t have been different in 1888.
      The back alleys became interesting, when they led a client to a “safe” place.
      So ‘Jack’ just followed the thoroughfares to look for victims.

      There’s another thought – don’t know if it’s of interest or redundant: When ‘Jack’ left his home, he didn’t know yet where he would find his next victim. Maybe he didn’t even know yet if he was in the mood for some more rippin’ …
      What I want to say: He didn’t walk straight to the next murder site, killed somebody and returned, but could have zigzagged through the streets for hours, avoiding cops, stalking prostitutes … He could have walked miles, only to find his next victim three blocks from home.
      Maybe he even zigzagged through the streets after the murder. Bloodstained clothes suggest going home quickly, but was he in a state of mind to grasp that thought?
      So we can’t be sure if we can match the murder sites and his “Welcome”-doormat, wherever it has lain, with the shortest possible route.

      Comment


      • #48
        Well said, K-453.

        It is a wee bit precarious to use the murder locations to predict where JtR was operating from. Humans in general can be expected to use the easiest or quickest route to get what they want (eg a loaf of bread from their nearest shop), while criminals will tend to avoid offending right on their own doorstep (eg they will go a bit further if they plan to steal the loaf then murder the shopkeeper).

        A serial bread stealer would probably want to target a different shop each time, either the same distance but in a different direction, or a bit further afield. But naturally his opportunities would depend on how many bread shops happened to be reasonably close to his home or place of work.

        Some serial killers choose to live where they know they can find easy victims, but others don't and have to 'commute'. Some actually prefer to commute. Unemployed Colin Ireland, for example, would steal his train fare from Southend-on-Sea to the same pub in Fulham each time to pick up and murder gay men. They took him back to their homes, which were naturally scattered in all directions from the pub. I don't know how even the most experienced geographical profiler could ever have predicted that the killer would be found on the Essex coast, either from the pick-up location or the various murder locations.


        The same problem could apply to the Whitechapel series, because rich or poor or anywhere in between, the ripper could so easily have travelled to the small area where he committed the murders, knowing he could find many a desperate prostitute walking the main roads looking for men to pick up and take down a dark side street to her 'patch' - semi-private and avoiding police beats etc. Equally he could have lived and/or worked within the area itself.

        Either way, the victims almost certainly dictated their own murder locations, while their killer could have chosen a different main road to trawl each time. So it cannot be assumed that any of the murder locations represented the ripper's choice, based on where he was residing at the time. It might not make a significant difference if each body was found mere yards from where he had been looking, but that would be quite another assumption and the area is so small, and was such a tangle of streets, alleys and passages in 1888, that it would seem a bold step for anyone to pinpoint an actual street for his "most likely" base, as I believe Rossmo did again recently with Flower & Dean.

        Love,

        Caz
        X
        Last edited by caz; 08-15-2011, 02:27 PM.
        "Comedy is simply a funny way of being serious." Peter Ustinov


        Comment


        • #49
          Originally posted by caz View Post
          Some serial killers choose to live where they know they can find easy victims, but others don't and have to 'commute'. Some actually prefer to commute. Unemployed Colin Ireland, for example, would steal his train fare from Southend-on-Sea to the same pub in Fulham each time to pick up and murder gay men. They took him back to their homes, which were naturally scattered in all directions from the pub. I don't know how even the most experienced geographical profiler could ever have predicted that the killer would be found on the Essex coast, either from the pick-up location or the various murder locations.
          She has been spotted, on numerous occasions, going into the Alma, the Pride of Spitalfields, the Duke of Wellington, the Princess Alice, the Aldgate Exchange, and the Monsoon.

          A geographic profiler with half a brain could tell you that she obviously emanates from Croydon.


          ~~~

          Many thanks to those that have provided input!

          Several interesting points and very difficult questions have been raised.

          As time permits, I will attempt to address each of them, in a piecemeal manner, over the course of the next three-to-four days.

          Comment


          • #50
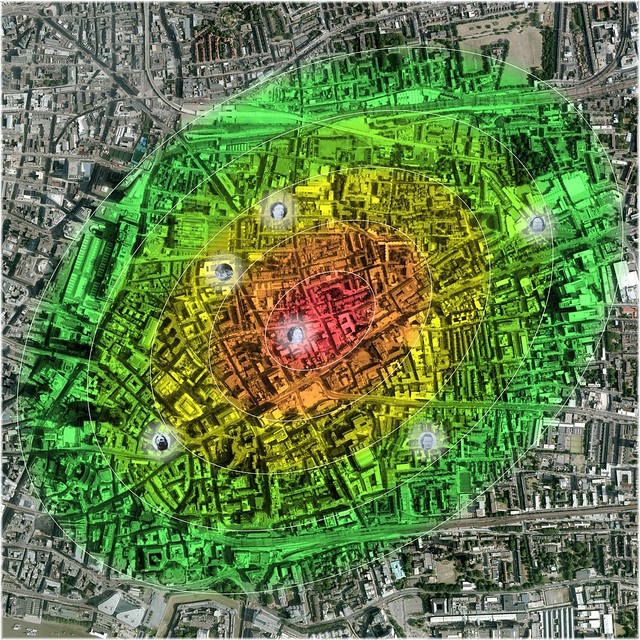
            The following image represents a different manner of depiction, of the probability distribution that has been generated, by the original (unrevised) manifestation of my Geographic Profile Model.


            Accumulation of Probability Distribution (Elliptical): Murder-Site Mean-Center, to Extent of Fifty Percent Accumulation (Click Image, to Enlarge in flickr)
            Underlying Aerial Imagery: Copyright Google Earth, 2010
            Overlying Plots, Labels and Color-Shadings: Copyright Colin C. Roberts, 2011

            Red (i.e. Area within the Inner-Most Contour): Accumulation of Probability Distribution (Elliptical), from Murder-Site Mean-Center, to Extent of 10.00% Accumulation
            - Standard Deviations from Murder-Site Mean-Center (Elliptical): 0.30
            - Semi-Major Axis: 214.97 Yards
            - Semi-Minor Axis: 152.48 Yards
            - Area: 0.03 Square-Miles
            - Accumulation of Probability Distribution: 10 Percentage Points
            - Density: 300.81 Percentage Points per Square-Mile


            Red/Orange (i.e. Total Area within the Two Inner-Most Contours): Accumulation of Probability Distribution (Elliptical), from Murder-Site Mean-Center, to Extent of 20.00% Accumulation
            - Standard Deviations from Murder-Site Mean-Center (Elliptical): 0.61
            - Semi-Major Axis: 434.50 Yards
            - Semi-Minor Axis: 308.18 Yards
            - Area: 0.14 Square-Miles
            - Accumulation of Probability Distribution: 20 Percentage Points
            - Density: 147.27 Percentage Points per Square-Mile


            Red/Orange/Yellow (i.e. Total Area within the Three Inner-Most Contours): Accumulation of Probability Distribution (Elliptical), from Murder-Site Mean-Center, to Extent of 30.00% Accumulation
            - Standard Deviations from Murder-Site Mean-Center (Elliptical): 0.94
            - Semi-Major Axis: 663.79 Yards
            - Semi-Minor Axis: 470.81 Yards
            - Area: 0.32 Square-Miles
            - Accumulation of Probability Distribution: 30 Percentage Points
            - Density: 94.65 Percentage Points per Square-Mile


            Red/Orange/Yellow/Yellow-Green (i.e. Total Area within the Four Inner-Most Contours): Accumulation of Probability Distribution (Elliptical), from Murder-Site Mean-Center, to Extent of 40.00% Accumulation
            - Standard Deviations from Murder-Site Mean-Center (Elliptical): 1.29
            - Semi-Major Axis: 909.66 Yards
            - Semi-Minor Axis: 645.20 Yards
            - Area: 0.60 Square-Miles
            - Accumulation of Probability Distribution: 40 Percentage Points
            - Density: 67.20 Percentage Points per Square-Mile


            Red/Orange/Yellow/Yellow-Green/Green (i.e. Total Area within the Five Contours): Accumulation of Probability Distribution (Elliptical), from Murder-Site Mean-Center, to Extent of 50.00% Accumulation
            - Standard Deviations from Murder-Site Mean-Center (Elliptical): 1.67
            - Semi-Major Axis: 1,181.71 Yards
            - Semi-Minor Axis: 838.16 Yards
            - Area: 1.00 Square-Miles
            - Accumulation of Probability Distribution: 50 Percentage Points
            - Density: 49.77 Percentage Points per Square-Mile


            In this instance, the blended spectral progression, from red to green, i.e. from 0˚ to 120˚, of the color-shaded elliptical region's hue is measured as follows:

            Red, i.e. 0˚
            - Distribution Accumulation: 0.00% - 10.00%

            Orange, i.e. 30˚
            - Distribution Accumulation: 10.00% - 20.00%

            Yellow, i.e. 60˚
            - Distribution Accumulation: 20.00% - 30.00%

            Yellow-Green, i.e. 90˚
            - Distribution Accumulation: 30.00% - 40.00%

            Green, i.e. 120˚
            - Distribution Accumulation: 40.00% - 50.00%


            As the spectral progression is blended, each of the ten-percentage-point intervals of distribution accumulation is defined by an elliptical white contour that facilitates the depiction of the respective interval, as a distinct isopleth.

            It should be noted that the blending of the spectral progression occurs within the periphery of each of the respective isopleths.

            In other words, it should be noted, for example, that the orange hue begins to blend with the subsequent yellow hue, within the periphery of the isopleth, to which the orange color-shading is assigned.

            This effect is intended to emphasize the fact that the density of probability percentage points, within each of the respective isopleths, is greatest at its central contour, and least at its peripheral contour.

            ~~~

            Please make particular note of the respective areas and probability densities of each of the depicted cumulative intervals, as noted above:

            Red
            - Area: 0.03 Square-Miles
            - Accumulation of Probability Distribution: 10 Percentage Points
            - Density: 300.81 Percentage Points per Square-Mile


            Red/Orange
            - Area: 0.14 Square-Miles
            - Accumulation of Probability Distribution: 20 Percentage Points
            - Density: 147.27 Percentage Points per Square-Mile


            Red/Orange/Yellow
            - Area: 0.32 Square-Miles
            - Accumulation of Probability Distribution: 30 Percentage Points
            - Density: 94.65 Percentage Points per Square-Mile


            Red/Orange/Yellow/Yellow-Green
            - Area: 0.60 Square-Miles
            - Accumulation of Probability Distribution: 40 Percentage Points
            - Density: 67.20 Percentage Points per Square-Mile


            Red/Orange/Yellow/Yellow-Green/Green
            - Area: 1.00 Square-Miles
            - Accumulation of Probability Distribution: 50 Percentage Points
            - Density: 49.77 Percentage Points per Square-Mile


            Then, please make particular note of the respective areas and probability densities of each of the depicted non-cumulative sequential intervals:

            Red
            - Area: 0.03 Square-Miles
            - Accumulation of Probability Distribution: 10 Percentage Points
            - Density: 300.81 Percentage Points per Square-Mile


            Orange
            - Area: 0.10 Square-Miles
            - Accumulation of Probability Distribution: 10 Percentage Points
            - Density: 97.50 Percentage Points per Square-Mile


            Yellow
            - Area: 0.18 Square-Miles
            - Accumulation of Probability Distribution: 10 Percentage Points
            - Density: 55.20 Percentage Points per Square-Mile


            Yellow-Green
            - Area: 0.28 Square-Miles
            - Accumulation of Probability Distribution: 10 Percentage Points
            - Density: 35.93 Percentage Points per Square-Mile


            Green
            - Area: 0.41 Square-Miles
            - Accumulation of Probability Distribution: 10 Percentage Points
            - Density: 24.43 Percentage Points per Square-Mile


            Note, for instance, the fact that the red isopleth, at the center of the elliptical color-shaded region, contains the same degree of distribution accumulation, as does the green isopleth, at the periphery of the same: Ten percentage points.

            Yet, because the red isopleth accounts for such a relatively small area, its probability density is a whopping 300.81 percentage points per square-mile, as compared to just 24.43 percentage points per square-mile, in the case of the green isopleth.

            Again, ...

            *** The red isopleth's probability density is a whopping 300.81 percentage points per square-mile, as compared to just 24.43 percentage points per square-mile, in the case of the green isopleth. ***

            So, even though the original (unrevised) manifestation of my Geographic Profile Model would suggest that we should perceive an identical probability, i.e. 10.00%, that 'Jack the Ripper' resided somewhere within either of the two respective isopleths, i.e. red or green, during the latter months of 1888; it would also suggest, nonetheless, that we perceive the red isopleth as being of more significance, i.e. as being more of a 'hot spot'.

            The Bottom Line:

            The original (unrevised) manifestation of my Geographic Profile Model would suggest that a concerted effort, involving the City of London Police Force and the Metropolitan Police Force, should have devoted 10.00% of its 'canvass' / 'random-search' resources, to each of the areas that is defined by a respective isopleth, as depicted in the above imagery; ... as well as, to each of the areas that would be defined by an as yet non-depicted isopleth: e.g. the isopleth that would account for the accumulation, ranging between 50.00% and 60.00% of the overall probability distribution; the isopleth that would account for the accumulation, ranging between 60.00% and 70.00% of the overall probability distribution; etc.

            ~~~

            Now that I have succeeded in overwhelming each of you, ...


            ... I would ask that you please try to digest the significance of that, which I have attempted to convey, in this very longwinded post.

            Several interesting points and very difficult questions have been raised, by those of you that have participated in this discussion.

            As time permits, I will attempt to address each of them, in a piecemeal manner, over the course of the next six-to-seven days.

            I am even planning to show Mr. Marriott where Carl Feigenbaum would fit into the grand scheme of things, were we able to place him in port, specifically at St. Katherine Docks, during the so-called 'Autumn of Terror'.

            My preliminary estimate is that Feigenbaum's 'residence', in this hypothetical instance, would fall within the forty fifth percentile of the overall probability distribution that pertains to the elusive 1888 residence of 'Jack the Ripper'.

            At this point, Feigenbaum, would pass the geographic litmus test, and his 'candidacy', so to speak, would then have be weighed, on the basis of all of its non-geographic merits.

            Comment


            • #51
              Originally posted by Colin Roberts View Post
              She has been spotted, on numerous occasions, going into the Alma, the Pride of Spitalfields, the Duke of Wellington, the Princess Alice, the Aldgate Exchange, and the Monsoon.

              A geographic profiler with half a brain could tell you that she obviously emanates from Croydon.


              LOL! It's all lies I tell you. 'She' only went into the Alma once and it has long since closed down, sadly.

              But a geographical profiler with no brain at all could tell you that she would inevitably bump into an American visitor in the Wellington and they would both be Chelsea fans.

              Love,

              Caz
              X
              "Comedy is simply a funny way of being serious." Peter Ustinov


              Comment


              • #52
                [.

                Some serial killers choose to live where they know they can find easy victims, but others don't and have to 'commute'. Some actually prefer to commute. Unemployed Colin Ireland, for example, would steal his train fare from Southend-on-Sea to the same pub in Fulham each time to pick up and murder gay men. They took him back to their homes, which were naturally scattered in all directions from the pub
                .
                There was a natural 'epicentre' for the killings -the Colehearne Pub.
                Colin Ireland had access to 'modern' transport.

                Either way, the victims almost certainly dictated their own murder locations, while their killer could have chosen a different main road to trawl each time
                .
                But he most probably left from the same point.

                I get it that he might have lived in different lodging houses. But they were probably in the same geographical area if he was seeking work in places where he had the most chance of getting work -i.e. where he had already worked before and had a network.
                http://youtu.be/GcBr3rosvNQ

                Comment


                • #53

                  Accumulation of Probability Distribution (Elliptical): Murder-Site Mean-Center, to Extent of Fifty Percent Accumulation (Click Image, to Enlarge in flickr)
                  Underlying Aerial Imagery: Copyright Google Earth, 2010
                  Overlying Plots, Labels and Color-Shadings: Copyright Colin C. Roberts, 2011

                  50.00% Accumulation of Probability Distribution

                  The original (unrevised) manifestation of my Geographic Profile Model would suggest a perceptual probability¹ of 50.00% that 'Jack the Ripper' resided somewhere within the above color-shaded elliptical region, during the latter months of 1888.

                  In other words, it would suggest that we should perceive a chance of as much as 1-in-2 that 'Jack the Ripper' resided somewhere - during the latter months of 1888 - within the above color-shaded elliptical region, having an area of 1.00 square-miles.

                  ¹ As we are dealing with a retrospective probability, we must refer to it as being 'perceptual', as opposed to being 'actual': The reason being that there is an actual probability of 100.00% that 'Jack of Ripper' resided wherever he did, during the latter months of 1888; as well as an actual probability of 0.00% that he resided anywhere else, during the same.


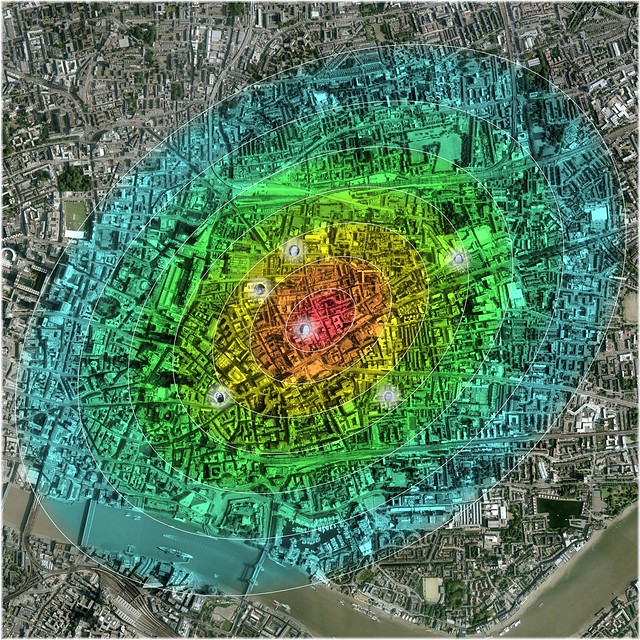
                  Accumulation of Probability Distribution (Elliptical): Murder-Site Mean-Center, to Extent of Seventy Percent Accumulation (Click Image, to Enlarge in flickr)
                  Underlying Aerial Imagery: Copyright Google Earth, 2010
                  Overlying Plots, Labels and Color-Shadings: Copyright Colin C. Roberts, 2011

                  70.00% Accumulation of Probability Distribution

                  The original (unrevised) manifestation of my Geographic Profile Model would suggest a perceptual probability¹ of 70.00% that 'Jack the Ripper' resided somewhere within the above color-shaded elliptical region, during the latter months of 1888.

                  In other words, it would suggest that we should perceive a chance of at least 2-in-3 that 'Jack the Ripper' resided somewhere - during the latter months of 1888 - within the above color-shaded elliptical region, having an area of 2.54 square-miles.

                  ¹ As we are dealing with a retrospective probability, we must refer to it as being 'perceptual', as opposed to being 'actual': The reason being that there is an actual probability of 100.00% that 'Jack of Ripper' resided wherever he did, during the latter months of 1888; as well as an actual probability of 0.00% that he resided anywhere else, during the same.

                  ...

                  In Practical Terms:

                  This would suggest that any concerted effort, involving the City of London Police Force and Metropolitan Police Force, which - hypothetically speaking - might have occurred during late November, 1888, ... should have devoted 10.00% of its 'canvass' / 'random-search' resources, to each of the areas that is defined, in the above imagery, by a respective isopleth:

                  Red
                  - 10.00%
                  Orange
                  - 10.00%
                  Yellow
                  - 10.00%
                  Yellow Green
                  - 10.00%
                  Lime Green
                  - 10.00%

                  Sub-Total (Former Image)
                  - 50.00%

                  Green
                  - 10.00%
                  Aqua
                  - 10.00%

                  Sub-Total (Latter Image)
                  - 70.00%


                  ~~~

                  Please note that the actual area that is covered by each of the respective isopleths, becomes progressively larger, as the process of accumulation of the overall probability distribution continues:

                  Red
                  - Area: 0.03 Square-Miles
                  Orange
                  - Area: 0.10 Square-Miles
                  Yellow
                  - Area: 0.18 Square-Miles
                  Yellow Green
                  - Area: 0.28 Square-Miles
                  Lime Green
                  - Area: 0.41 Square-Miles

                  Total Elliptical Region (Former Image)
                  - Area: 1.00 Square-Miles

                  Green
                  - Area: 0.60 Square-Miles
                  Aqua
                  - Area: 0.93 Square-Miles

                  Total Elliptical Region (Latter Image)
                  - Area: 2.54 Square-Miles


                  Also, please note that the probability density of the area that is covered by each of the respective isopleths, becomes progressively smaller, as the process of accumulation of the overall probability distribution continues:

                  Red
                  - Probability Density: 300.81 Percentage Points per Square-Mile
                  Orange
                  - Probability Density: 97.50 Percentage Points per Square-Mile
                  Yellow
                  - Probability Density: 55.20 Percentage Points per Square-Mile
                  Yellow Green
                  - Probability Density: 35.93 Percentage Points per Square-Mile
                  Lime Green
                  - Probability Density: 24.43 Percentage Points per Square-Mile

                  Total Elliptical Region (Former Image)
                  - Probability Density: 49.77 Percentage Points per Square-Mile

                  Green
                  - Probability Density: 16.56 Percentage Points per Square-Mile
                  Aqua
                  - Probability Density: 10.71 Percentage Points per Square-Mile

                  Total Elliptical Region (Latter Image)
                  - Probability Density: 27.54 Percentage Points per Square-Mile

                  Comment


                  • #54
                    Context:

                    Originally posted by caz View Post
                    Originally posted by Colin Roberts View Post
                    I am merely suggesting that we should all be willing to bet 'even money' that 'Jack the Ripper' resided somewhere¹ within the above color-shaded elliptical region, during the latter months of 1888: A region, having an area of an entire square mile.

                    ¹ i.e. most likely at the center (red: i.e. relatively 'hot'), and least likely on the periphery (cyan: i.e. relatively 'cold').

                    Does anyone - honestly - believe that such a contention is too bold?
                    If I understand you correctly, it would equally not be too bold to bet ‘even money’ (no more, no less) that Jack was residing outside your square mile region, coming in each time to commit murder (possibly among other business he had there, but not necessarily), and consequently being out of reach of the police searches.

                    In short, the chances of him residing within your square mile (A) are exactly the same as the chances of him residing anywhere on the vast outside (B). If that is your contention, based on your calculations, I trust it and have no problem with it.

                    But I imagine the chances of actually locating him if he was residing outside, compared with the relatively tiny inside, would be an entirely different matter! We don’t seem to have the kind of evidence that could realistically narrow down the much larger area (A + B) we would need to search to be 100% (as opposed to 50%) sure that he was actually there during the relevant period of 1888.

                    One other thing - could you explain for this Chelsea fan, with a lesser ability than you to grasp all this, why it is most likely, if he was residing on the inside, that it was at the centre, and least likely at the edge? I think I get this bit, but to be sure and putting it in the simplest terms, is it a bit like saying that if he was residing on the vast outside, it was most likely to be just outside your square mile and least likely to be at the other side of the globe?
                    Point by Point:

                    Originally posted by caz View Post
                    ..., it would equally not be too bold to bet ‘even money’ (no more, no less) that Jack was residing outside your square mile region, coming in each time to commit murder ..., and consequently being out of reach of the police searches.
                    Correct, Caz!

                    The bet would be considered 'fair', from either of the two perspectives: i.e. that he resided somewhere within the elliptical color-shaded region, or that he resided somewhere without the elliptical color-shaded region.

                    Originally posted by caz View Post
                    In short, the chances of him residing within your square mile (A) are exactly the same as the chances of him residing anywhere on the vast outside (B).
                    Correct, again, Caz!

                    So, the significance of this proposition is based upon the fact that there is practically an entire 'world', i.e. 'B', outside the elliptical color-shaded region, consisting of a single square-mile, i.e. 'A'.

                    Originally posted by caz View Post
                    ... the chances of actually locating him if he was residing outside, compared with the relatively tiny inside, would be an entirely different matter! We don’t seem to have the kind of evidence that could realistically narrow down the much larger area (A + B) we would need to search to be 100% (as opposed to 50%) sure that he was actually there during the relevant period of 1888.
                    Of course, Caz, we will never 'locate' him, simply by drawing and color-shading ellipses! Never!

                    But, if by drawing and color-shading ellipses, we are able to establish a meaningful focal point, as well as an equally meaningful set of parameters, for the conduct of an investigative 'canvass' / 'random-search', ... we just might get somewhere.

                    In the hypothetical event that those that were charged with the investigation of these murders, in 1888, had been blessed with (effectively) limitless resources, for the conduct of investigative 'canvass' / 'random-search' endeavors; I would contend that they should have devoted 50.00% of those resources to the elliptical color-shaded region, to which we have both been referring.

                    Likewise, I would contend that they should have devoted 70.00% (inclusive of the aforementioned 50.00%) of those resources to the larger elliptical color-shaded region that I have more recently depicted.

                    ~~~

                    Let's turn our attention, Caz, to that larger elliptical color-shaded region that I have more recently depicted: i.e. the one containing 70.00% of the probability distribution that pertains to the elusive 1888 residence of 'Jack the Ripper', as opposed to just 50.00%; i.e. the one consisting of 2.54 square-miles, as opposed to just 1.00 square-miles.

                    --- Incidentally, when I get around to depicting an elliptical color-shaded region that contains 90.00% of the applicable probability distribution, it's going to consist of 7.72 square-miles; and when I get around to depicting an elliptical color-shaded region that contains 99.50% of the applicable probability distribution, it's going to consist of 43.33 square-miles. ---

                    Originally posted by caz View Post
                    ..., why it is most likely, if he was residing on the inside, that it was at the centre, and least likely at the edge? I think I get this bit, but to be sure and putting it in the simplest terms, is it a bit like saying that if he was residing on the vast outside, it was most likely to be just outside your square mile and least likely to be at the other side of the globe?
                    Imagine a very concentrated Luftwaffe air raid that managed to drop 10.00% of its bombs within each of the areas that is defined, in the above imagery, by a respective isopleth:

                    Red
                    - 10.00%
                    Orange
                    - 10.00%
                    Yellow
                    - 10.00%
                    Yellow Green
                    - 10.00%
                    Lime Green
                    - 10.00%
                    Green
                    - 10.00%
                    Aqua
                    - 10.00%

                    Sub-Total
                    - 70.00%


                    What point, in the above imagery, would mark the single most likely location of a human fatality, in direct consequence of this air raid?

                    The original (unrevised) manifestation of my Geographic Profile Model would suggest a perceptual probability of 10.00% that 'Jack the Ripper' resided somewhere within the red color-shaded isopleth, during the latter months of 1888, as well as a perceptual probability of 10.00% that he resided somewhere within the aqua color-shaded isopleth, during the same.

                    Accordingly, we should perceive a chance of 1-in-10 that 'Jack the Ripper' resided within the red color-shaded region, as well as a chance of 1-in-10 that he resided within the aqua color-shaded region, during the so-called 'Autumn of Terror'.

                    However, any particular dwelling that was situated within the red color-shaded region, in 1888, would be 'tinted', in this instance, with a greater concentration of probability, pertaining to the elusive 1888 residence of 'Jack the Ripper', than would any particular dwelling that was situated within the aqua color-shaded region, during the same period.

                    Similarly, any particular dwelling that was situated within the red color-shaded region, during the aforementioned hypothetical Luftwaffe air raid, would be more likely to have been destroyed, than would any particular dwelling that was situated within the aqua color-shaded region, during the same.

                    I hope that make sense!

                    Please, do not hesitate to say so, if it does not!

                    ~~~

                    This unrevised manifestation of my Geographic Profile Model - I will discuss my planned revisions, at some later juncture - would suggest that the dwelling that was situated on the southwest corner of Wentworth Street and Osborn Street, in the Parish of St. Mary Whitechapel, in 1888, should be perceived as having been the single most likely residence of 'Jack the Ripper', during the so-called 'Autumn of Terror'.

                    Have I ever bothered to look into the identities of those that lived in this particular dwelling, during the latter months of 1888?

                    No!

                    Will I ever do so?

                    No!

                    Why, you might ask?

                    Because, even though my unrevised model would 'tint' this particular dwelling with a greater portion of the applicable probability distribution than that, with which it would 'tint' any other dwelling, - anywhere - it would still afford this dwelling substantially less than one percentage point.

                    And, that would be done within a vacuum of ideals, in which certain realities were ignored, in order to accommodate the development of a 'usable' and 'useful' model.

                    ~~~

                    I will say this much, regarding the planned revisions of my Geographic Profile Model:

                    The elliptical probability distribution that the revised model will generate, will be centered on the intersection of Thrawl Street and George Street, in the Parish of Christ Church Spitalfields.

                    Accordingly, the dwellings that stood on each of the four corners of that intersection, in 1888, will be tagged as being the dwellings that should be perceived as having been the four most likely residences of 'Jack the Ripper', during the so-called 'Autumn of Terror'. Because of the orientation of the elliptical probability distribution, the dwellings on the southwest and northeast corners, of the intersection, will be afforded ever-so-slightly greater portions of the overall probability distribution.

                    Do I have any plans to look into the identities of those that resided in any of these four dwellings, during the latter months of 1888?

                    No!

                    Of course, I don't!

                    But, will I insist that any investigative 'canvass' / 'random-search' endeavors, upon which anyone wishes to embark, begin with these four dwellings, and radiate therefrom, in accordance with the elliptical proportions of the probability distribution that my revised model will have generated?

                    Yes!

                    Absolutely!

                    Will I insist that something on the order of 8.00% - 12.00% of all resources afforded to any such endeavor, be devoted to the area that was bounded, in 1888, by the north side of Flower & Dean Street, the east side of Brick Lane, the south side of Wentworth Street, and the west side of Commercial Street; and centered on the intersection of Thrawl Street and George Street; having been - with the exception of the south side of Wentworth Street - entirely situated within the Parish of Christ Church Spitalfields?

                    Yes!

                    Most definitely!

                    --- More to Follow ---

                    Comment


                    • #55

                      Accumulation of Probability Distribution (Elliptical): Murder-Site Mean-Center, to Extent of Seventy Percent Accumulation (Click Image, to Enlarge in flickr)
                      Underlying Aerial Imagery: Copyright Google Earth, 2010
                      Overlying Plots, Labels and Color-Shadings: Copyright Colin C. Roberts, 2011

                      Originally posted by caz View Post
                      ..., why it is most likely, if he was residing on the inside, that it was at the centre, and least likely at the edge? I think I get this bit, but to be sure and putting it in the simplest terms, is it a bit like saying that if he was residing on the vast outside, it was most likely to be just outside your square mile and least likely to be at the other side of the globe?
                      I do not believe that I have effectively addressed this issue, Caz, so I shall attempt to do so, yet again.

                      My suggestion that the 1888 residence of 'Jack the Ripper' was more likely to have been near the center of the elliptical color-shaded region, and less likely to have been near the periphery of the same, was inaccurate, and accordingly misleading.

                      In fact, I would contend that we should perceive the likelihood of the 1888 residence of 'Jack the Ripper' having been situated somewhere within the red color-shaded region, as being identical to that of it having been situated somewhere within the aqua color-shaded region, as depicted in the above imagery:

                      Perceptual Probability: 10.00%
                      Perceptual Chance: 1-in-10
                      Perceptual Odds: 9-to-1


                      However, ...

                      --- A Qualifier of Crucial Importance ---

                      ... were we to select a particular dwelling that was situated within the red color-shaded region, in 1888, and compare the likelihood of it having been the contemporary domicile of 'Jack the Ripper', to that of any dwelling that was situated within the aqua color-shaded region, during the same period; we should perceive a sharp contrast.

                      In fact, we should perceive the former likelihood, i.e. that, which would apply to a particular dwelling that was situated within the red color-shaded region, as being approximately twenty eight times greater than the latter, i.e. that of any dwelling that was situated within the aqua color-shaded region.

                      Why?

                      Because the red color-shaded isopleth, in this instance, is 'tinted' with a probability density that is approximately twenty eight times greater than that, with which the aqua color-shaded isopleth is 'tinted'.

                      Red
                      - Probability Density: 300.81 Percentage Points per Square-Mile
                      Orange
                      - Probability Density: 97.50 Percentage Points per Square-Mile
                      Yellow
                      - Probability Density: 55.20 Percentage Points per Square-Mile
                      Yellow Green
                      - Probability Density: 35.93 Percentage Points per Square-Mile
                      Lime Green
                      - Probability Density: 24.43 Percentage Points per Square-Mile
                      Green
                      - Probability Density: 16.56 Percentage Points per Square-Mile
                      Aqua
                      - Probability Density: 10.71 Percentage Points per Square-Mile

                      Total Elliptical Region
                      - Probability Density: 27.54 Percentage Points per Square-Mile


                      Some Cases in Point:

                      On the basis of geography, i.e. geography alone, we should perceive John Simmonds as being approximately five times more likely to have been 'Jack the Ripper', than were either Joseph Barnett, or Aaron Kosminski; and approximately twenty eight times more likely to have been the same, than were either Montague Druitt¹, or the Vicar of the Parish Church of St. George in the East².

                      ¹ Allowing for the possibility that Druitt might have used Cannon Street Station, or perhaps a hotel in very close proximity thereto, as a 'base of operations'.

                      ² Whoever that happened to be, in 1888.

                      Who's John Simmonds?

                      I see he was mentioned earlier today, in a different thread:

                      Originally posted by curious View Post
                      Actually, I can quote Jon Guy in a thread from Dec. 10, 2009:

                      I have absolutely no interest in Suspect Ripperology but there was an interesting chappy called John Simmonds, who was a 22 yr old hawker who lived at 60 Wentworth St, and he was admitted to the Whitechapel Infirmary a week after the double event suffering from syphilis, and was discharged on Nov 8th!!
                      Please Note:

                      The above comparisons of the geographic viabilities, of certain suspects / persons of interest, are derived from 'eyeball' estimates, which I will attempt to refine, at some later date.

                      Also, the comparisons must be viewed from a suitable perspective; e.g. from the point of view that a Spitalfields dollymop that was in possession of twenty eight farthings, was twenty eight times more 'wealthy' than was some other wretch that was in possession of just one farthing.

                      Originally posted by Abby Normal View Post
                      Originally posted by Colin Roberts View Post
                      Imagine a fifty pound bag of white sand being poured through a stationary funnel that is situated at a height of ... let's say ... three feet, above a level plane (e.g. a floor).

                      Invariably, a mound of nearly perfect symmetry will be formed.

                      Also, imagine that a single black grain of sand is to be found, somewhere, within that mound.

                      If you had to describe that mound from the two-dimensional perspective that was achieved, by viewing it from directly above; where then, within that (seemingly two-dimensional) distribution of sand, would you say that the single black grain was most likely to be found?

                      At its center?

                      On its periphery?

                      Hint: When viewing the mound from a three-dimensional perspective, it should be obvious that the grains of sand are standing perhaps ten-thousand-high, at the center, but only one-or-two-high, at the periphery.
                      I'll take a stab at it! Since its forming a mound or cone shape, more grains of sand will be in the center. Therefore, when viewing from above (2-D) there is a greater chance the black grain of sand will be found closer to the center.
                      Ladies and Gentlemen, ...

                      A round of applause, please, for Mr. Abby Normal!

                      Originally posted by Trevor Marriott View Post
                      Originally posted by Colin Roberts View Post
                      It is quite interesting to note the order of ascendency of various contemporary suspects, e.g. Aaron Kosminski, and modern-day persons of interest, e.g. Joseph Barnett, within the context of a particular geographic profile.

                      ...

                      However, it is just that: 'Quite Interesting'; nothing more, ... nothing less.

                      If a contemporary suspect or modern-day person of interest is known to have resided within the observed parameters of the 'killing-field' of 'Jack the Ripper', during the latter months of 1888, then a substantial degree of geographic viability is established.

                      The cases against Aaron Kosminski and Joseph Barnett, for example, must be comparatively weighed, on the basis of other 'merits', as each of these persons of interest has easily passed the geographic 'litmus test'.

                      The case against Carl Feigenbaum, on the other hand, doesn't exist, as his whereabouts, during the latter months of 1888, are not known.

                      Pulp publications and sensational documentaries notwithstanding, Feigenbaum cannot be administered the geographic 'litmus test'. Until such time as he can be, there is no case to be made for his 'candidacy'.
                      Why dont you make it a fair match by weighing up the other factors to be considered when looking at the suspects. The fact is as Caz suggest there was nothing more than a 50/50 chance that the killer either came from Whitechapel or from outside Whitechapel.

                      If you want to shorten the odds either way try looking at the other factors which must be considered for and against the "suspects" and as you sarcastically mentioned Feigenbaum perhaps you should add him to the equation to compare with from within Whitechapel or from outside.

                      How many of them were known to carry a knife

                      How many of them actually murdered anyone

                      By my reckoning 70/30 in favour of from outside
                      The answer is quite simple:

                      This isn't intended to be a "fair match", or, for that matter, a "match", of any suspect 'attributes', other than those that pertain specifically to geography.

                      Geography!

                      Is 'good old-fashioned police methodology' so crusty that you are unable to see the potential benefits of comparing various suspects / persons of interest, on a single basis, such as geographic proximity?

                      Originally posted by Colin Roberts View Post
                      I am even planning to show Mr. Marriott where Carl Feigenbaum would fit into the grand scheme of things, were we able to place him in port, specifically at St. Katherine Docks, during the so-called 'Autumn of Terror'.

                      My preliminary estimate is that Feigenbaum's 'residence', in this hypothetical instance, would fall within the forty fifth percentile of the overall probability distribution that pertains to the elusive 1888 residence of 'Jack the Ripper'.

                      At this point, Feigenbaum, would pass the geographic litmus test, and his 'candidacy', so to speak, would then have be weighed, on the basis of all of its non-geographic merits.
                      I will do this, when I am able to set aside the necessary amount of time.

                      At this point, it should be evident that the main entrance to Feigenbaum's 'residence', i.e. his hypothetical 'base', in this instance, would fall within the area that is depicted by the green isopleth, in the above imagery.

                      This isopleth represents the interval of probability distribution accumulation, 50.00% - 60.00%.

                      The main entrance to Feigenbaum's hypothetical 'base', therefore, would fall within the fortieth-to-fiftieth percentile, of the overall distribution of probability that has been generated by my unrevised profile model.

                      I would consider anything within the tenth percentile to be 'easy passage', so to speak, of the geographic litmus test.

                      But, do know that on the basis of geography, i.e. geography alone, we should be compelled, in this hypothetical instance, to consider Aaron Kosminski as being approximately three times more likely to have been 'Jack the Ripper', than was Carl Feigenbaum.


                      And, also know that this would be applicable, only to the hypothetical instance, in which you were able to place Feigenbaum in port, specifically at St. Katherine Docks, during the so-called 'Autumn of Terror'.

                      Originally posted by K-453 View Post
                      The murder sites could be close to thoroughfares because that’s probably where the prostitutes were practising their work. I mean, today they’re gathering at streets where’s enough traffic at night and not at some dark and empty back alleys – shouldn’t have been different in 1888.
                      The back alleys became interesting, when they led a client to a “safe” place.
                      So ‘Jack’ just followed the thoroughfares to look for victims.

                      There’s another thought – don’t know if it’s of interest or redundant: When ‘Jack’ left his home, he didn’t know yet where he would find his next victim. Maybe he didn’t even know yet if he was in the mood for some more rippin’ …
                      What I want to say: He didn’t walk straight to the next murder site, killed somebody and returned, but could have zigzagged through the streets for hours, avoiding cops, stalking prostitutes … He could have walked miles, only to find his next victim three blocks from home.
                      Maybe he even zigzagged through the streets after the murder. Bloodstained clothes suggest going home quickly, but was he in a state of mind to grasp that thought?
                      So we can’t be sure if we can match the murder sites and his “Welcome”-doormat, wherever it has lain, with the shortest possible route.
                      Addressing this post will, indeed, be challenging.

                      I will attempt to do so, when I am able to set aside the necessary amount of time.

                      The solution is very simple, as far as I am concerned. But, its conveyance will be no easy task.

                      For the time being, I will simply make note of the fact that were we to spot a particular fish, at six varying locations, within the English Channel, on six separate occasions; then, seasonal and tidal considerations notwithstanding, our best bet for spotting that fish, in an area that he would be most likely to consider his 'home', would be in the immediate vicinity of either the mean-center of our six observations, the median-center of our six observations, or some combination thereof.

                      The amount of 'zigzag' movement that might have occurred, between those six observations, is really not that relevant.

                      I will attempt to expound on this point, at some later date.

                      As for my supposed attempt to "match the murder sites and his “Welcome”-doormat, wherever it has lain, with the shortest possible route": I can assure you that I am not attempting to do anything of the sort.

                      I would have no inclination to attempt the IMPOSSIBLE!

                      Comment


                      • #56
                        How would this change if you used Polly Nichols as the first, and figured for just the canonical 5 instead of including Martha Trabram and six victims?

                        Thanks,

                        curious

                        Comment


                        • #57
                          Originally posted by Rubyretro View Post
                          There was a natural 'epicentre' for the killings -the Colehearne Pub.
                          Colin Ireland had access to 'modern' transport.
                          The Coleherne was where Ireland picked up all his victims. It was their natural epicentre, being a gay-friendly pub (just like the natural Spitalfields epicentre for the most desperate dollymops in 1888, just trying to survive). Ireland's killing took place back at the individual victim's home, and the pub itself was a most unnatural venue for anyone - gay or straight - to 'commute' to from Southend. But then Ireland's sole purpose was unnatural in the extreme: to make a name for himself as a serial killer. (Jack got himself the name, whether he wanted it or no.)

                          This made it virtually impossible for the police to link any of the killings, either back to the Coleherne or to the killer's base, without help from Ireland himself. He provided it by phoning them with various hints and tips that only the killer could have known.

                          And why should the ripper not have had access to ‘modern’ transport? If anything, the trains were faster and more reliable back then, and if unemployed Ireland could steal the cash for his fares, I'm sure Jack would have had no trouble doing the same.

                          Love,

                          Caz
                          X
                          Last edited by caz; 08-31-2011, 08:07 PM.
                          "Comedy is simply a funny way of being serious." Peter Ustinov


                          Comment


                          • #58
                            From the initial post of the thread entitled "Where did the Ripper likely live?":

                            Originally posted by RipperNoob View Post
                            ..., something I've read often is that the Ripper was likely local to Whitechapel, that his being able to escape from the crime scenes so swiftly and without being noticed or captured lends to at least a working knowledge of the streets of Whitechapel and the alleys. The fact that the crimes--the canonical five anyway, along with Tabram--happened in a rather close proximity suggests that Whitechapel was where the killer lived.

                            Do any of you agree that he was probably a local to Whitechapel? If so, have any of you ever proposed where he might've lived, what street?
                            I don't mind admitting that it is extremely disheartening to see that thread degenerating, as it has, - over the course of the most recent two-week period, and through the duration of its 112 posts - into a discussion regarding whether Catherine Eddowes was soliciting when she met her demise, without so much as a mention - from anyone - of the analysis that I have been presenting, in this thread.

                            Oh, well!

                            ~~~

                            The first two, of the following three images, have been 'improved', so I believe, in as much as the color-intensity of each of the respective isopleths, has been progressively diminished, in conjunction with the spectral progression that dictates its hue; i.e. in conjunction with the outward progression, from red, to orange, to yellow, etc.

                            This 'improvement' is intended to emphasize the fact that the density of the applicable geographic-profile probability distribution, itself, progressively diminishes, in conjunction with that spectral progression.

                            The third, of the following three images, is a 'new release'.


                            Accumulation of Probability Distribution (Elliptical): Murder-Site Mean-Center, to Extent of Fifty Percent Accumulation (Click Image, to Enlarge in flickr)
                            Underlying Aerial Imagery: Copyright Google Earth, 2010
                            Overlying Plots, Labels and Color-Shadings: Copyright Colin C. Roberts, 2011

                            50.00% Accumulation of Probability Distribution

                            The original (unrevised) manifestation of my Geographic Profile Model would suggest a perceptual probability¹ of 50.00% that 'Jack the Ripper' resided somewhere within the above color-shaded elliptical region, during the latter months of 1888.

                            In other words, it would suggest that we should perceive a chance of as much as 1-in-2 that 'Jack the Ripper' resided somewhere - during the latter months of 1888 - within the above color-shaded elliptical region, having an area of 1.00 square-miles.


                            Accumulation of Probability Distribution (Elliptical): Murder-Site Mean-Center, to Extent of Seventy Percent Accumulation (Click Image, to Enlarge in flickr)
                            Underlying Aerial Imagery: Copyright Google Earth, 2010
                            Overlying Plots, Labels and Color-Shadings: Copyright Colin C. Roberts, 2011

                            70.00% Accumulation of Probability Distribution

                            The original (unrevised) manifestation of my Geographic Profile Model would suggest a perceptual probability¹ of 70.00% that 'Jack the Ripper' resided somewhere within the above color-shaded elliptical region, during the latter months of 1888.

                            In other words, it would suggest that we should perceive a chance of at least 2-in-3 that 'Jack the Ripper' resided somewhere - during the latter months of 1888 - within the above color-shaded elliptical region, having an area of 2.54 square-miles.


                            Accumulation of Probability Distribution (Elliptical): Murder-Site Mean-Center, to Extent of Ninety Percent Accumulation (Click Image, to Enlarge in flickr)
                            Underlying Aerial Imagery: Copyright Google Earth, 2010
                            Overlying Plots, Labels and Color-Shadings: Copyright Colin C. Roberts, 2011

                            90.00% Accumulation of Probability Distribution

                            The original (unrevised) manifestation of my Geographic Profile Model would suggest a perceptual probability¹ of 90.00% that 'Jack the Ripper' resided somewhere within the above color-shaded elliptical region, during the latter months of 1888.

                            In other words, it would suggest that we should perceive a chance of as much as 9-in-10 that 'Jack the Ripper' resided somewhere - during the latter months of 1888 - within the above color-shaded elliptical region, having an area of 7.72 square-miles.

                            ¹ As we are dealing with a retrospective probability, we must refer to it as being 'perceptual', as opposed to being 'actual': The reason being that there is an actual probability of 100.00% that 'Jack of Ripper' resided wherever he did, during the latter months of 1888; as well as an actual probability of 0.00% that he resided anywhere else, during the same.

                            ~~~

                            Red (i.e. Area within the Inner-Most Contour): Accumulation of Probability Distribution (Elliptical), from Murder-Site Mean-Center, to Extent of 10.00% Accumulation
                            - Standard Deviations from Murder-Site Mean-Center (Elliptical): 0.30
                            - Semi-Major Axis: 214.97 Yards
                            - Semi-Minor Axis: 152.48 Yards
                            - Area: 0.03 Square-Miles
                            - Accumulation of Probability Distribution: 10 Percentage Points
                            - Distribution Density: 300.81 Percentage Points per Square-Mile

                            Red/Orange (i.e. Total Area within the Two Inner-Most Contours): Accumulation of Probability Distribution (Elliptical), from Murder-Site Mean-Center, to Extent of 20.00% Accumulation
                            - Standard Deviations from Murder-Site Mean-Center (Elliptical): 0.61
                            - Semi-Major Axis: 434.50 Yards
                            - Semi-Minor Axis: 308.18 Yards
                            - Area: 0.14 Square-Miles
                            - Accumulation of Probability Distribution: 20 Percentage Points
                            - Distribution Density: 147.27 Percentage Points per Square-Mile


                            Red/Orange/Yellow (i.e. Total Area within the Three Inner-Most Contours): Accumulation of Probability Distribution (Elliptical), from Murder-Site Mean-Center, to Extent of 30.00% Accumulation
                            - Standard Deviations from Murder-Site Mean-Center (Elliptical): 0.94
                            - Semi-Major Axis: 663.79 Yards
                            - Semi-Minor Axis: 470.81 Yards
                            - Area: 0.32 Square-Miles
                            - Accumulation of Probability Distribution: 30 Percentage Points
                            - Distribution Density: 94.65 Percentage Points per Square-Mile


                            Red/Orange/Yellow/Yellow-Green (i.e. Total Area within the Four Inner-Most Contours): Accumulation of Probability Distribution (Elliptical), from Murder-Site Mean-Center, to Extent of 40.00% Accumulation
                            - Standard Deviations from Murder-Site Mean-Center (Elliptical): 1.29
                            - Semi-Major Axis: 909.66 Yards
                            - Semi-Minor Axis: 645.20 Yards
                            - Area: 0.60 Square-Miles
                            - Accumulation of Probability Distribution: 40 Percentage Points
                            - Distribution Density: 67.20 Percentage Points per Square-Mile


                            Red/Orange/Yellow/Yellow-Green/Lime-Green (i.e. Total Area within the Five Inner-Most Contours): Accumulation of Probability Distribution (Elliptical), from Murder-Site Mean-Center, to Extent of 50.00% Accumulation
                            - Standard Deviations from Murder-Site Mean-Center (Elliptical): 1.67
                            - Semi-Major Axis: 1,181.71 Yards
                            - Semi-Minor Axis: 838.16 Yards
                            - Area: 1.00 Square-Miles
                            - Accumulation of Probability Distribution: 50 Percentage Points
                            - Distribution Density: 49.77 Percentage Points per Square-Mile


                            Red/Orange/Yellow/Yellow-Green/Lime-Green/Green (i.e. Total Area within the Six Inner-Most Contours): Accumulation of Probability Distribution (Elliptical), from Murder-Site Mean-Center, to Extent of 60.00% Accumulation
                            - Standard Deviations from Murder-Site Mean-Center (Elliptical): 2.11
                            - Semi-Major Axis: 1,495.22 Yards
                            - Semi-Minor Axis: 1,060.53 Yards
                            - Area: 1.61 Square-Miles
                            - Accumulation of Probability Distribution: 60 Percentage Points
                            - Distribution Density: 37.31 Percentage Points per Square-Mile


                            Red/Orange/Yellow/Yellow-Green/Lime-Green/Green/Aqua (i.e. Total Area within the Seven Inner-Most Contours): Accumulation of Probability Distribution (Elliptical), from Murder-Site Mean-Center, to Extent of 70.00% Accumulation
                            - Standard Deviations from Murder-Site Mean-Center (Elliptical): 2.66
                            - Semi-Major Axis: 1,879.80 Yards
                            - Semi-Minor Axis: 1,333.30 Yards
                            - Area: 2.54 Square-Miles
                            - Accumulation of Probability Distribution: 70 Percentage Points
                            - Distribution Density: 27.54 Percentage Points per Square-Mile


                            Red/Orange/Yellow/Yellow-Green/Lime-Green/Green/Aqua/Blue (i.e. Total Area within the Eight Inner-Most Contours): Accumulation of Probability Distribution (Elliptical), from Murder-Site Mean-Center, to Extent of 80.00% Accumulation
                            - Standard Deviations from Murder-Site Mean-Center (Elliptical): 3.39
                            - Semi-Major Axis: 2,400.16 Yards
                            - Semi-Minor Axis: 1,702.38 Yards
                            - Area: 4.14 Square-Miles
                            - Accumulation of Probability Distribution: 80 Percentage Points
                            - Distribution Density: 19.30 Percentage Points per Square-Mile


                            Red/Orange/Yellow/Yellow-Green/Lime-Green/Green/Aqua/Blue/Indigo (i.e. Total Area within the Nine Contours): Accumulation of Probability Distribution (Elliptical), from Murder-Site Mean-Center, to Extent of 90.00% Accumulation
                            - Standard Deviations from Murder-Site Mean-Center (Elliptical): 4.63
                            - Semi-Major Axis: 3,276.65 Yards
                            - Semi-Minor Axis: 2,324.06 Yards
                            - Area: 7.72 Square-Miles
                            - Accumulation of Probability Distribution: 90 Percentage Points
                            - Distribution Density: 11.65 Percentage Points per Square-Mile


                            In this instance, the blended spectral progression, from red to indigo, i.e. from 0˚ to 240˚, of the color-shaded elliptical region's hue is measured as follows:

                            Red, i.e. 0˚
                            - Distribution Accumulation: 0.00% - 10.00%

                            Orange, i.e. 30˚
                            - Distribution Accumulation: 10.00% - 20.00%

                            Yellow, i.e. 60˚
                            - Distribution Accumulation: 20.00% - 30.00%

                            Yellow-Green, i.e. 90˚
                            - Distribution Accumulation: 30.00% - 40.00%

                            Lime-Green, i.e. 120˚
                            - Distribution Accumulation: 40.00% - 50.00%

                            Green, i.e. 150˚
                            - Distribution Accumulation: 50.00% - 60.00%

                            Aqua, i.e. 180˚
                            - Distribution Accumulation: 60.00% - 70.00%

                            Blue, i.e. 210˚
                            - Distribution Accumulation: 70.00% - 80.00%

                            Indigo, i.e. 240˚
                            - Distribution Accumulation: 80.00% - 90.00%


                            As the spectral progression is blended, each of the ten-percentage-point intervals of distribution accumulation is defined by an elliptical white contour that facilitates the depiction of the respective interval, as a distinct isopleth.

                            ~~~

                            Originally posted by Rubyretro View Post
                            Originally posted by caz View Post
                            Some serial killers choose to live where they know they can find easy victims, but others don't and have to 'commute'. Some actually prefer to commute. Unemployed Colin Ireland, for example, would steal his train fare from Southend-on-Sea to the same pub in Fulham each time to pick up and murder gay men. They took him back to their homes, which were naturally scattered in all directions from the pub.
                            Colin Ireland had access to 'modern' transport.
                            So too, did a whole hell of a lot of people, in 1888's 'Greater London'!

                            ~~~

                            Originally posted by caz View Post
                            Some serial killers choose to live where they know they can find easy victims, but others don't and have to 'commute'. Some actually prefer to commute. Unemployed Colin Ireland, for example, would steal his train fare from Southend-on-Sea to the same pub in Fulham each time to pick up and murder gay men. They took him back to their homes, which were naturally scattered in all directions from the pub. I don't know how even the most experienced geographical profiler could ever have predicted that the killer would be found on the Essex coast, either from the pick-up location or the various murder locations.
                            Originally posted by caz View Post
                            Either way, the victims almost certainly dictated their own murder locations, while their killer could have chosen a different main road to trawl each time. So it cannot be assumed that any of the murder locations represented the ripper's choice, based on where he was residing at the time. It might not make a significant difference if each body was found mere yards from where he had been looking, but that would be quite another assumption and the area is so small, and was such a tangle of streets, alleys and passages in 1888, that it would seem a bold step for anyone to pinpoint an actual street for his "most likely" base, as I believe Rossmo did again recently with Flower & Dean.
                            Originally posted by curious View Post
                            How would this change if you used Polly Nichols as the first, and figured for just the canonical 5 instead of including Martha Trabram and six victims?
                            I will attempt to address these issues, at some point, within the next two-to-three days.

                            And, ...

                            Originally posted by Colin Roberts View Post
                            Originally posted by K-453 View Post
                            The murder sites could be close to thoroughfares because that’s probably where the prostitutes were practising their work. I mean, today they’re gathering at streets where’s enough traffic at night and not at some dark and empty back alleys – shouldn’t have been different in 1888.
                            The back alleys became interesting, when they led a client to a “safe” place.
                            So ‘Jack’ just followed the thoroughfares to look for victims.

                            There’s another thought – don’t know if it’s of interest or redundant: When ‘Jack’ left his home, he didn’t know yet where he would find his next victim. Maybe he didn’t even know yet if he was in the mood for some more rippin’ …
                            What I want to say: He didn’t walk straight to the next murder site, killed somebody and returned, but could have zigzagged through the streets for hours, avoiding cops, stalking prostitutes … He could have walked miles, only to find his next victim three blocks from home.
                            Maybe he even zigzagged through the streets after the murder. Bloodstained clothes suggest going home quickly, but was he in a state of mind to grasp that thought?
                            So we can’t be sure if we can match the murder sites and his “Welcome”-doormat, wherever it has lain, with the shortest possible route.
                            Addressing this post will, indeed, be challenging.

                            I will attempt to do so, when I am able to set aside the necessary amount of time.

                            The solution is very simple, as far as I am concerned. But, its conveyance will be no easy task.

                            For the time being, I will simply make note of the fact that were we to spot a particular fish, at six varying locations, within the English Channel, on six separate occasions; then, seasonal and tidal considerations notwithstanding, our best bet for spotting that fish, in an area that he would be most likely to consider his 'home', would be in the immediate vicinity of either the mean-center of our six observations, the median-center of our six observations, or some combination thereof.

                            The amount of 'zigzag' movement that might have occurred, between those six observations, is really not that relevant.

                            I will attempt to expound on this point, at some later date.

                            As for my supposed attempt to "match the murder sites and his “Welcome”-doormat, wherever it has lain, with the shortest possible route": I can assure you that I am not attempting to do anything of the sort.

                            I would have no inclination to attempt the IMPOSSIBLE!
                            ... I will attempt to further address this issue, when I am able to set aside the necessary amount of time.

                            Comment


                            • #59
                              Colin Ireland had access to 'modern' transport.
                              Exactly, Ruby.

                              I've never really understood the comparison between Ireland and the ripper in terms of his physical movements. While it is quite true that the former selected his victims from a specific location, his actual murder and disposal sites were very widely dispersed. Even if Ireland had not been caught, there was enough crime scene evidence for investigators to determine that the killer was using public transport. Not so with the Whitechapel murder, whose murder and disposal locations were all within very short walking distance of each other. Overwhelming evidence from other serial crimes should inform us that such small-scale criminal "maps" are usually (always?) perpetrated by men who walked to those locations from where they lived, which was often somewhere residing within the "circle" encompassing all murder sites or somewhere not far outside of it.

                              A "commuter", on the other hand, will rarely, if ever, "commute" into the same tiny region time and time again, in spite of the investigative focus being increased in that area after each murder committed there, and in spite of the prevalence of prostitutes elsewhere in London. It wasn't as though there was a specific "type" of prostitute that Jack preferred, who could only be found in Whitechapel and Spitalfields. We can't exclude the possibility of this exceptionally rare phenomenon occurring in the case of the Whitechapel murderers, but to accord it equal probability with the marauder model would be foolhardy, in my opinion.

                              All the best,
                              Ben

                              Comment


                              • #60
                                Hi Ben,

                                But it's not as if the Colherne in Fulham was used by a specific 'type' of gay man, yet Ireland chose this remote sweet shop to pick up goodies he could have got in a thousand other places between Southend and London.

                                If the gay men he had picked up had taken him to a dark street near the pub for quick sex, or had all lived close to this pub, you would have seen a similar pattern of victim locations to the ripper series and concluded the killer was your local ne'er do well - and been totally wrong. Ireland only used the same public transport as his victims had used to get home and be killed by him.

                                Love,

                                Caz
                                X
                                "Comedy is simply a funny way of being serious." Peter Ustinov


                                Comment

                                Working...
                                X