
 Tweet
Tweet
I know this is a five year old story but I have only just found it.
Head of analysis for Scotland Yard's Violent Crime Command Laura Richards
Jack the Ripper's face 'revealed'
An e-fit showing what detectives believe serial killer Jack the Ripper looked like has been revealed.
Using new profiling techniques, investigators have created a picture of what they believe the 19th Century murderer would have looked like.
The man, who evaded police in the 1880s, is thought to have killed and mutilated five London prostitutes.
The Scotland Yard team describe him as "frighteningly normal" but someone capable of "extraordinary cruelty".
And investigators have admitted that police at the time were probably searching for the wrong kind of man.
Head of analysis for Scotland Yard's Violent Crime Command Laura Richards, who has studied serial killer Fred West and Soham murderer Ian Huntley, revisited the case using modern police techniques.
TV documentary
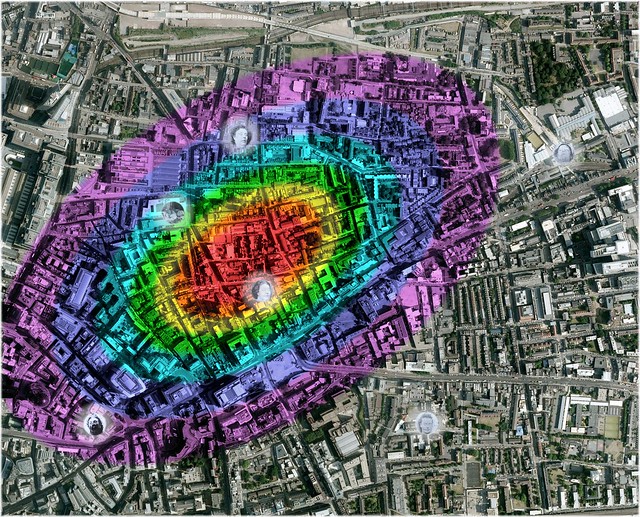
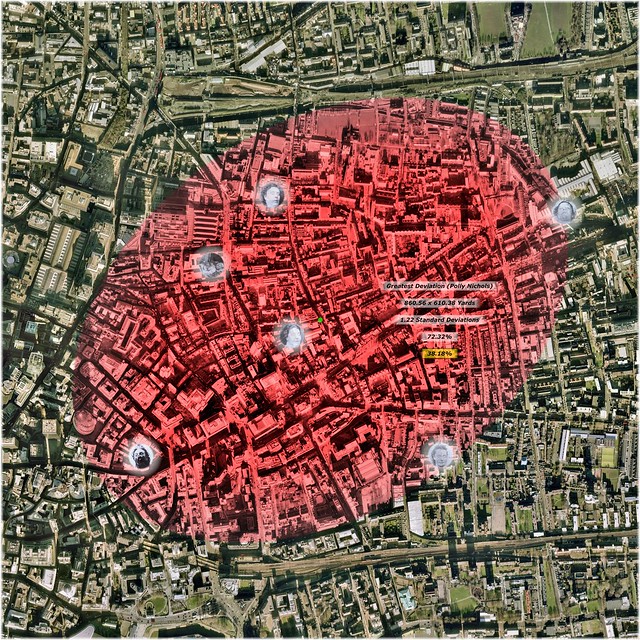
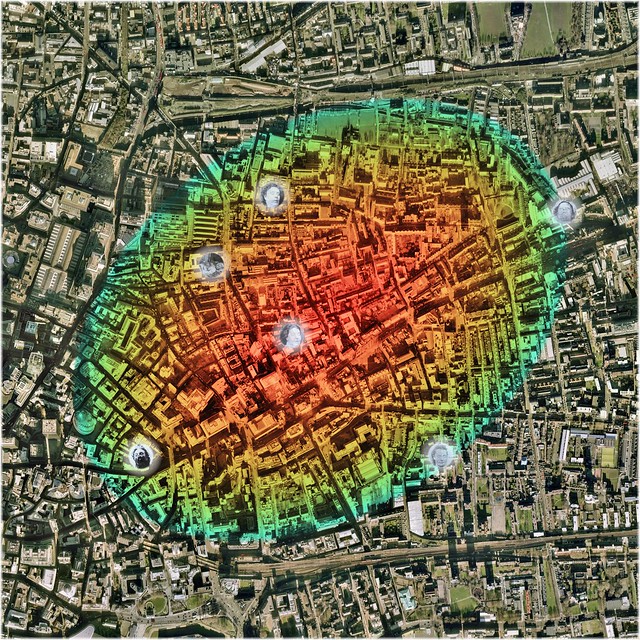
She brought together a team of experts, including pathologists, historians and a geographical profiler, to find out if the case could ever be solved.
The result has been the most accurate physical, geographical and psychological portrait of the Ripper ever put together.
It will be revealed in a documentary on the TV channel Five on Tuesday.
“ This is further than anyone else has got. It would have been enough for coppers to get out and start knocking on doors... they would have got him ”
Metropolitan Police Commander John Grieve
Ms Richards said the 118-year-old evidence shows the Ripper was between the ages of 25 and 35, between 5ft 5ins and 5ft 7ins tall. He was also of stocky build.
Investigators have even been able to pinpoint his address.
Ms Richards said: "For the first time, we are able to understand the kind of person Jack the Ripper was.
"We can name the street where he probably lived; and we can see what he looked like; and we can explain, finally, why this killer eluded justice."
Never caught
Metropolitan Police Commander John Grieve, who has worked with the team of experts, believes the killer would have been caught if officers at the time had this new information.
"This is further than anyone else has got," he said. "It would have been enough for coppers to get out and start knocking on doors... they would have got him."
Did Miss Richards ever give us the address?
Helena
Head of analysis for Scotland Yard's Violent Crime Command Laura Richards
Jack the Ripper's face 'revealed'
An e-fit showing what detectives believe serial killer Jack the Ripper looked like has been revealed.
Using new profiling techniques, investigators have created a picture of what they believe the 19th Century murderer would have looked like.
The man, who evaded police in the 1880s, is thought to have killed and mutilated five London prostitutes.
The Scotland Yard team describe him as "frighteningly normal" but someone capable of "extraordinary cruelty".
And investigators have admitted that police at the time were probably searching for the wrong kind of man.
Head of analysis for Scotland Yard's Violent Crime Command Laura Richards, who has studied serial killer Fred West and Soham murderer Ian Huntley, revisited the case using modern police techniques.
TV documentary
She brought together a team of experts, including pathologists, historians and a geographical profiler, to find out if the case could ever be solved.
The result has been the most accurate physical, geographical and psychological portrait of the Ripper ever put together.
It will be revealed in a documentary on the TV channel Five on Tuesday.
“ This is further than anyone else has got. It would have been enough for coppers to get out and start knocking on doors... they would have got him ”
Metropolitan Police Commander John Grieve
Ms Richards said the 118-year-old evidence shows the Ripper was between the ages of 25 and 35, between 5ft 5ins and 5ft 7ins tall. He was also of stocky build.
Investigators have even been able to pinpoint his address.
Ms Richards said: "For the first time, we are able to understand the kind of person Jack the Ripper was.
"We can name the street where he probably lived; and we can see what he looked like; and we can explain, finally, why this killer eluded justice."
Never caught
Metropolitan Police Commander John Grieve, who has worked with the team of experts, believes the killer would have been caught if officers at the time had this new information.
"This is further than anyone else has got," he said. "It would have been enough for coppers to get out and start knocking on doors... they would have got him."
Did Miss Richards ever give us the address?
Helena


Comment