Announcement

Collapse
No announcement yet.

Laura Richards knows who the ripper was

Collapse
X
 
  • Filter
  • Time
  • Show
Clear All
new posts

  • Laura Richards knows who the ripper was

    I know this is a five year old story but I have only just found it.

    Head of analysis for Scotland Yard's Violent Crime Command Laura Richards

    Jack the Ripper's face 'revealed'
    An e-fit showing what detectives believe serial killer Jack the Ripper looked like has been revealed.
    Using new profiling techniques, investigators have created a picture of what they believe the 19th Century murderer would have looked like.
    The man, who evaded police in the 1880s, is thought to have killed and mutilated five London prostitutes.
    The Scotland Yard team describe him as "frighteningly normal" but someone capable of "extraordinary cruelty".
    And investigators have admitted that police at the time were probably searching for the wrong kind of man.
    Head of analysis for Scotland Yard's Violent Crime Command Laura Richards, who has studied serial killer Fred West and Soham murderer Ian Huntley, revisited the case using modern police techniques.
    TV documentary
    She brought together a team of experts, including pathologists, historians and a geographical profiler, to find out if the case could ever be solved.
    The result has been the most accurate physical, geographical and psychological portrait of the Ripper ever put together.
    It will be revealed in a documentary on the TV channel Five on Tuesday.
    “ This is further than anyone else has got. It would have been enough for coppers to get out and start knocking on doors... they would have got him ”
    Metropolitan Police Commander John Grieve
    Ms Richards said the 118-year-old evidence shows the Ripper was between the ages of 25 and 35, between 5ft 5ins and 5ft 7ins tall. He was also of stocky build.
    Investigators have even been able to pinpoint his address.
    Ms Richards said: "For the first time, we are able to understand the kind of person Jack the Ripper was.
    "We can name the street where he probably lived; and we can see what he looked like; and we can explain, finally, why this killer eluded justice."
    Never caught
    Metropolitan Police Commander John Grieve, who has worked with the team of experts, believes the killer would have been caught if officers at the time had this new information.
    "This is further than anyone else has got," he said. "It would have been enough for coppers to get out and start knocking on doors... they would have got him."


    Did Miss Richards ever give us the address?

    Helena
    Helena Wojtczak BSc (Hons) FRHistS.

    Author of 'Jack the Ripper at Last? George Chapman, the Southwark Poisoner'. Click this link : - http://www.hastingspress.co.uk/chapman.html

  • #2
    Flower and Dean Street

    Modern technology has provided the first image of the face of Britain's most elusive killer. An e-fit of Jack the Ripper has been compiled as part of an investigation, by one of Scotland Yard's most respected former detectives, into the serial killer who terrorised London in the autumn of 1888.

    Comment


    • #3
      Thanks, I must have missed that report.

      So, who of the supects lived in "Flowery" Dean Street?
      Helena Wojtczak BSc (Hons) FRHistS.

      Author of 'Jack the Ripper at Last? George Chapman, the Southwark Poisoner'. Click this link : - http://www.hastingspress.co.uk/chapman.html

      Comment


      • #4
        JK

        Hello Helena. Try John Kelly.

        Cheers.
        LC

        Comment


        • #5
          I had begun this post, several days ago, with the following:

          ~~~

          Originally posted by HelenaWojtczak View Post
          She brought together a team of experts, including pathologists, historians and a geographical profiler, to find out if the case could ever be solved.
          The result has been the most accurate physical, geographical and psychological portrait of the Ripper ever put together.

          ...

          Investigators have even been able to pinpoint his address.

          ...

          "We can name the street where he probably lived; ..."

          ...

          Did Miss Richards ever give us the address?
          "Investigators have even been able to pinpoint his address."

          "We can name the street where he probably lived; ..."


          To whoever is responsible for the above assertions - presumably, persons involved in the documentary broadcast:

          No, they have not!

          And, ...

          No, you cannot!

          Each of those assertions is a gross misrepresentation of the intended purpose of any geographic profile analysis!

          Originally posted by gallicrow View Post
          "The programme consulted Kim Rossmo, of the University of Texas, a pioneer of geographic profiling - a technique that uses previous crimes to calculate where a offender lives.

          Based on the locations of the killings and sightings, Dr Rossmo concluded that the Ripper was a resident of the square mile area in which he killed. He is most likely to have lived in Flower and Dean Street - where police in 1888 had conducted out door-to-door inquiries. In the year before the murders each of the victims had lived within 100 yards of the street."

          The Independent

          ...

          Indeed, a feature of the television documentary was Dr. Kim Rossmo's application of his proprietary Criminal Geographic Target analysis, to the 'Macnaghten-Five' murder-sites: Nichols, Chapman, Stride, Eddowes, and Kelly.


          Screen-Capture: "Revealed" - Jack the Ripper: The First Serial Killer (2006)
          A Portion of the Probability Distribution that was Generated by Kim Rossmo's Criminal Geographic Target Analysis, of the 'Macnaghten-Five' Murder-Sites

          Rossmo's CGT designates a rectangular 'search area' that is divided into 40,000 'cells', to each of which a proprietary 'distance-decay' function is applied. Each 'cell' is thereby assessed as to its likelihood of having played host to the residence of 'Jack the Ripper'.

          "… the peak area, where the profile is falling on, covers Flower & Dean Street, Fashion Street, Thrawl Street, …"

          Kim Rossmo

          ~~~

          ... But, I was forced to set it aside, because of time constraints.

          I will refer those that are interested, to the following post, which can be found by clicking the 'quote prompt' (i.e. white arrow):

          Originally posted by Colin Roberts View Post
          If only there were a way of getting the field of 'Ripperology' to understand the most fundamental principles of a probability distribution.


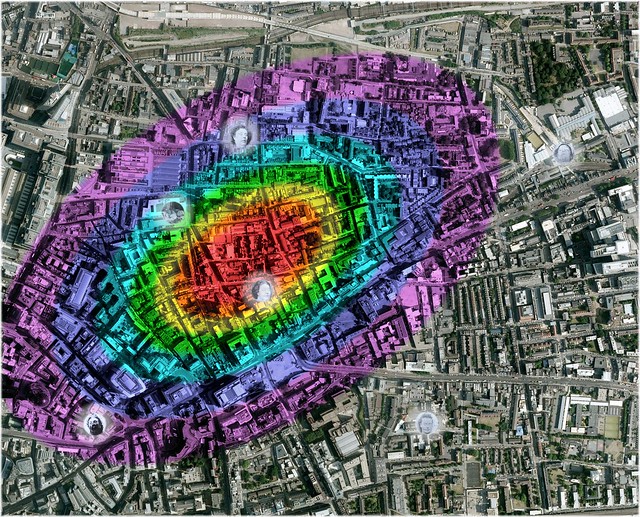
          Hypothetical Probability Distribution (Elliptical) (Click Image, to Enlarge in flickr)
          Underlying Aerial Imagery: Copyright Google Earth, 2010
          Overlying Plots, Labels and Color-Shadings: Copyright Colin C. Roberts, 2011

          Let's pretend that the above imagery is a Doppler Radar depiction of the most concentrated portion of a cloud of precipitation that happens to be hovering over London's inner 'East End'.

          Let's also pretend that each of the color-shaded isopleths represents exactly ten percent of the rainfall that is occurring, and that the density of each set of ten percentage points is greatest at the inner elliptical contour of each of the respective isopleths, and least at the outer elliptical contour of the same.

          In other words, let's also pretend that the density of the depicted rainfall is greatest at the center of the overall elliptical distribution (i.e. the intersection of Thrawl Street and George Street, in the Parish of Christ Church Spitalfields), and least at its periphery.

          Now, let's pretend that somewhere within this distribution of raindrops, there is a single Golden Raindrop that is proving to be quite elusive.

          I would contend that its single most probable location is the center of the overall elliptical distribution of rainfall (again, the intersection of Thrawl Street and George Street, in the Parish of Christ Church Spitalfields).

          But, does that imply that its probable location is the center of the overall elliptical distribution of rainfall?

          In other words, does that imply that its location is 'probably' the aforementioned intersection of Thrawl Street and George Street?

          Absolutely, positively not!

          Under no circumstances, whatsoever, does that imply anything of the sort!

          In fact, the probability that the elusive Golden Raindrop is to be found, specifically, at that intersection, is so low that it is effectively zero percent.

          So, what then, must I say, in order to define the area, in which the elusive Golden Raindrop is probably to be found?

          Any takers (other than Chris Phillips)?
          This post, in itself, is disjointed.

          Please forgive me!

          But, hopefully the readership will realize ...

          ... that in any case, Kim Rossmo did not, in any way, shape, or form, suggest that 'Jack the Ripper' 'probably' lived in Flower & Dean Street.
          Last edited by Colin Roberts; 07-27-2011, 09:12 PM.

          Comment


          • #6
            Wow Colin thanks for the effort you have put into this. I am not sure I understand that small pic (what is that big blue blob for example) but the one you quoted makes sense.

            So what she is saying is that the big red splodge is the epicentre and Jack is most likely to have lived in that red area, then the yellow and green bands represent the next most likely, and so on?

            I see five faces on that map and am wondering which of them isn't one of the C5.

            Thanks again

            Helena
            Helena Wojtczak BSc (Hons) FRHistS.

            Author of 'Jack the Ripper at Last? George Chapman, the Southwark Poisoner'. Click this link : - http://www.hastingspress.co.uk/chapman.html

            Comment


            • #7
              Originally posted by HelenaWojtczak View Post
              I am not sure I understand that small pic (what is that big blue blob for example) but the one you quoted makes sense.
              The blue "blob" is a valley in the probability distribution, i.e. a 'cold spot', whereas the red 'blobs' are peaks, i.e. 'hot spots'.

              The irregular 'asymmetric' shapes of the color-shaded isopleths are a function of the complexity of Kim Rossmo's Criminal Geographic Target model.

              I simply cannot conceive of a predictable pattern of human behavior that would dictate such a degree of asymmetry.

              Originally posted by Colin Roberts View Post
              ... complex models of geographic-profile analysis, such as Canter's proprietary Dragnet and Rossmo's proprietary Criminal Geographic Target, in my opinion, involve excessive manifestations of TMI (i.e. too much information) that tend to 'milk' the spatial relationships that exist within a set of murder-sites, for infinitely more than they are worth.
              Originally posted by HelenaWojtczak View Post
              So what she is saying is ...
              He! Kim Rossmo is a man.

              Originally posted by HelenaWojtczak View Post
              ... the big red splodge is the epicentre and Jack is most likely to have lived in that red area, then the yellow and green bands represent the next most likely, and so on?
              More-or-Less!

              In the hypothetical Golden Raindrop scenario that I described, - in the post, which I was quoting - each color-shaded isopleth depicts ten percentage points of the overall distribution of rainfall:

              Red: 10.00%
              Orange: 10.00%
              Yellow: 10.00%
              Green: 10.00%
              Aqua: 10.00%
              Blue: 10.00%
              Purple: 10.00%

              In this instance, the red color-shaded isopleth covers the smallest area - anywhere - that contains ten percentage points of the overall distribution.

              Hence, it is of greatest interest!

              Likewise, the purple color-shaded isopleth covers the largest area - depicted - that contains ten percentage points of the overall distribution.

              Hence, it is of least interest!

              If we consider these portions of the overall distribution, on a cumulative basis, we have:

              Red: 10.00% - This is the smallest area, anywhere, that contains ten percent of the overall distribution of rainfall.
              Red, Orange: 20.00% - This is the smallest area, anywhere, that contains twenty percent of the overall distribution of rainfall.
              Red, Orange, Yellow: 30.00% - This is the smallest area, anywhere, that contains thirty percent of the overall distribution of rainfall.
              Red, Orange, Yellow, Green: 40.00% - This is the smallest area, anywhere, that contains forty percent of the overall distribution of rainfall.
              Red, Orange, Yellow, Green, Aqua: 50.00% - This is the smallest area, anywhere, that contains fifty percent of the overall distribution of rainfall.
              Red, Orange, Yellow, Green, Aqua, Blue: 60.00% - This is the smallest area, anywhere, that contains sixty percent of the overall distribution of rainfall.
              Red, Orange, Yellow, Green, Aqua, Blue, Purple: 70.00% - This is the smallest area, anywhere, that contains seventy percent of the overall distribution of rainfall.
              ---
              Not Depicted: 70.01% - 100.00%

              Originally posted by Colin Roberts View Post
              ..., let's pretend that somewhere within this distribution of raindrops, there is a single Golden Raindrop that is proving to be quite elusive.

              I would contend that its single most probable location is the center of the overall elliptical distribution of rainfall (again, the intersection of Thrawl Street and George Street, in the Parish of Christ Church Spitalfields).

              But, does that imply that its probable location is the center of the overall elliptical distribution of rainfall?

              In other words, does that imply that its location is 'probably' the aforementioned intersection of Thrawl Street and George Street?

              Absolutely, positively not!

              Under no circumstances, whatsoever, does that imply anything of the sort!

              In fact, the probability that the elusive Golden Raindrop is to be found, specifically, at that intersection, is so low that it is effectively zero percent.

              So, what then, must I say, in order to define the area, in which the elusive Golden Raindrop is probably to be found?
              So, Helena, ... can you define (i.e. describe) a region, in which this Golden Raindrop is 'probably' located?

              If you correlate this concept with that of a probability distribution, pertaining to the elusive residence of 'Jack the Ripper', can you then define (i.e. describe) a region, in which this residence was 'probably' located?

              *** Please, remember that the elliptical probability distribution that I have depicted, is purely hypothetical.

              Originally posted by HelenaWojtczak View Post
              I see five faces on that map and am wondering which of them isn't one of the C5.
              Click on the image, itself.

              From the enlargement, you should recognize the victims' photographs.
              Last edited by Colin Roberts; 07-28-2011, 01:14 AM.

              Comment


              • #8
                Colin,

                I'm going to demonstrate my ignorance now, but how does population density affect the calculations? I mean, returning to the raindrops analogy, that works (in my head) provided that the density of raindrops per square yard (or whatever) is equal across the shaded zones, but could it work if the density varied between different areas?

                Regards,

                Mark

                Comment


                • #9
                  What color would 24 New Street, Bishopsgate be on this map, I wonder.

                  Comment


                  • #10
                    I thought that smart serial killers tend to live outside or at the periphery of their area of operation, not at the epicentre (Peter Sutcliffe for example). Also, am I missing something but why does Elizabeth Stride not seem to be influencing the distribution of the isopleths on this map?

                    Wynne

                    Comment


                    • #11
                      Originally posted by m_w_r View Post
                      ... how does population density affect the calculations? I mean, returning to the raindrops analogy, that works (in my head) provided that the density of raindrops per square yard (or whatever) is equal across the shaded zones, but could it work if the density varied between different areas?
                      Thanks for biting, Mark.

                      The raindrop density is not uniform.

                      It is greatest at the center of the overall elliptical distribution, and least at its periphery.

                      As the center of the elliptical distribution is the point of greatest raindrop density, it is, in turn, the point of most probable location of the elusive Golden Raindrop.

                      If we were to correlate this with the notion of a hypothetical distribution of probability, pertaining to the residence of 'Jack the Ripper', then we would conclude that the center of the intersection of Thrawl Street and George Street, in the Parish of Christ Church Spitalfields, - in this hypothetical instance - was the point of most probable location of the elusive residence.

                      But, at no single point, within the distribution is there any definable accumulation of any portion of the overall distribution of either raindrops, or probability.

                      There is, however, an ellipse that is concentric and proportional to each of the color-shaded isopleths, that contains an accumulation of ... let's say ... one one-millionth of one percent of the overall distribution of either raindrops, or probability.

                      There is, also, an ellipse that is concentric and proportional to each of the color-shaded isopleths, that contains an accumulation of ... two one-millionths of one percent of the overall distribution of either raindrops, or probability.

                      There is, also, an ellipse that is concentric and proportional to each of the color-shaded isopleths, that contains an accumulation of ... three one-millionths of one percent of the overall distribution of either raindrops, or probability.

                      Etc.

                      In the red color-shaded isopleth, we have an ellipse that is concentric and proportional to each of the other color-shaded isopleths, that contains an accumulation of ... ten percent of the overall distribution of either raindrops, or probability.

                      In the red and orange color-shaded isopleths, we have an ellipse that is concentric and proportional to each of the other color-shaded isopleths, that contains an accumulation of ... twenty percent of the overall distribution of either raindrops, or probability.

                      In the red, orange and yellow color-shaded isopleths, we have an ellipse that is concentric and proportional to each of the other color-shaded isopleths, that contains an accumulation of ... thirty percent of the overall distribution of either raindrops, or probability.

                      Etc.

                      ~~~

                      At what level of accumulation will we be able to say that we have 'probably' captured the elusive Golden Raindrop, as well as the elusive residence of 'Jack the Ripper'?

                      Comment


                      • #12
                        Hi Colin,

                        Thanks (I think!). But I'm still not following. Suppose that there are three murders. One occurs in my house (thirty feet long from front to back), one in the house next door to the left (identical to mine), and one in the house next door to the right (identical to mine). I look like the main suspect, geographically, but I happen to live only in the front room on the ground floor, and all the murders occurred on the back doorsteps of the three houses. Now, geographically, a man living down at the back of my back garden (thirty feet long) would be at exactly the same geographical distance as I am from each individual murder site. But because there isn't a man living down at the back of my back garden (that is, the population of that region is less dense), it would be silly to say that there is an equal probability of the murderer having come (a) from my front room, where I live, with blood all over me and a kidney stewing for dinner, and (b) from the back of my back garden, where nobody lives.

                        I'll cheerfully withdraw from this when you advise me that I'm out of my depth, but I wondered how difficulties of this sort are taken into account in some of the calculations. You can tell this is hypothetical - I haven't got a back garden.

                        Regards,

                        Mark

                        Comment


                        • #13
                          Originally posted by m_w_r View Post
                          I'll cheerfully withdraw from this when you advise me that I'm out of my depth, but I wondered how difficulties of this sort are taken into account in some of the calculations. You can tell this is hypothetical - I haven't got a back garden.
                          You're not out of your depth, Mark, ... yet. But, if I attempt to confront this issue, then neither one of us is going to be able to 'touch the bottom'.

                          I didn't understand your question, initially. But, now I think I know what's on your mind.

                          If, for instance, a geographic-profile probability distribution were to extend across the River Thames, should the portion of that distribution that actually covered the river, be re-allocated elsewhere? And, should the dispersion of the overall distribution's density be adjusted accordingly?

                          Ideally, ... yes!

                          Ideally!

                          But, such an endeavor would be extremely tricky, to say the least!

                          ~~~

                          Please bear in mind that my sole purpose, within the realm of this particular discussion, is the conveyance of the most fundamental principles of a probability distribution, as they would apply to geographic criminal profiling.

                          The overwhelming majority of 'Ripperologists', I am afraid, ...


                          Hypothetical Probability Distribution (Elliptical) (Click Image, to Enlarge in flickr)
                          Underlying Aerial Imagery: Copyright Google Earth, 2010
                          Overlying Plots, Labels and Color-Shadings: Copyright Colin C. Roberts, 2011

                          ... would quickly glance at this hypothetical geographic-profile probability distribution, and assume that it suggested that 'Jack the Ripper' probably resided at the center of the red color-shaded isopleth.

                          Remember my description of the overall distribution, on a cumulative basis:

                          Red: 10.00%
                          Red, Orange: 20.00%
                          Red, Orange, Yellow: 30.00%
                          Red, Orange, Yellow, Green: 40.00%
                          Red, Orange, Yellow, Green, Aqua: 50.00%
                          Red, Orange, Yellow, Green, Aqua, Blue: 60.00%
                          Red, Orange, Yellow, Green, Aqua, Blue, Purple: 70.00%
                          ---
                          Not Depicted: 70.01% - 100.00%

                          In other words:

                          In the red color-shaded isopleth, we have an ellipse that is concentric and proportional to each of the other color-shaded isopleths, that contains an accumulation of ... ten percent of the overall distribution of either raindrops, or probability.

                          In the red and orange color-shaded isopleths, we have an ellipse that is concentric and proportional to each of the other color-shaded isopleths, that contains an accumulation of ... twenty percent of the overall distribution of either raindrops, or probability.

                          In the red, orange and yellow color-shaded isopleths, we have an ellipse that is concentric and proportional to each of the other color-shaded isopleths, that contains an accumulation of ... thirty percent of the overall distribution of either raindrops, or probability.

                          Etc.

                          So ...

                          Originally posted by Colin Roberts View Post
                          At what level of accumulation will we be able to say that we have 'probably' captured the elusive Golden Raindrop, as well as the elusive residence of 'Jack the Ripper'?
                          The answer:

                          Red, Orange, Yellow, Green, Aqua, plus ... let's say ... one square-millimeter, from within Blue (ground level): ~50.01%

                          ~~~

                          Now, were this anything other than a hypothetical geographic-profile probability distribution, it would have be viewed as being excessively overconfident.

                          My Geographic Profile Model is undergoing a great deal of revision; ...


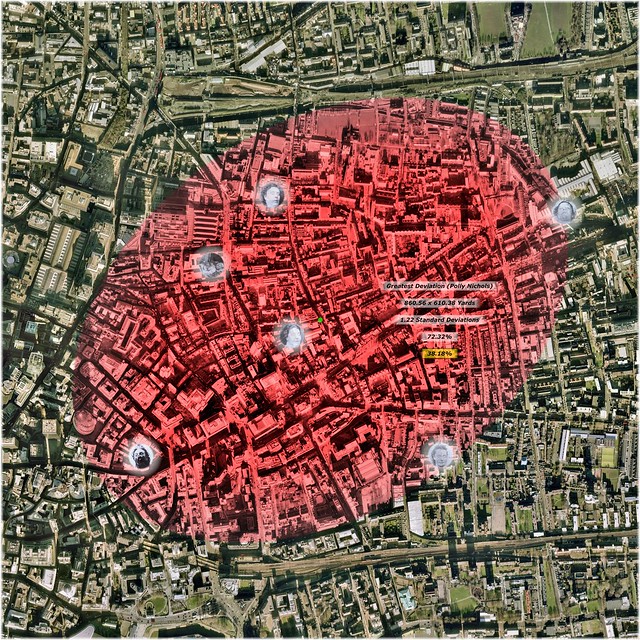
                          Cumulative Probability Distribution: Murder-Site Mean-Center, to Extent of Greatest Deviation, i.e. Mary Ann Nichols Murder-Site (Elliptical) (Click Image, to Enlarge in flickr)
                          Underlying Aerial Imagery: Copyright Google Earth, 2007
                          Overlying Plots, Labels and Color-Shadings: Copyright Colin C. Roberts, 2009

                          Red: Accumulation of Probability Distribution, from Murder-Site Mean-Center (Green Dot), to Extent of Greatest Deviation, i.e. Mary Ann Nichols Murder-Site (Elliptical)
                          - Standard Deviations from Murder-Site Mean-Center (Elliptical): 1.22
                          - Semi-Major Axis: 860.56 Yards
                          - Semi-Minor Axis: 610.38 Yards
                          - Area: 0.53 Square-Miles
                          - Accumulation of Probability Distribution (Murder-Site 'Population'): 72.32%*
                          - Accumulation of Probability Distribution (Geographic Profile Model): 38.18%**

                          * Given a perception of late November 1888 that this series of murders would continue ad infinitum; the expectation should have been that 72.32% would occur within the specified elliptical region, i.e. within 1.22 Standard Deviations of the murder-site Mean-Center (green dot).

                          This can be loosely interpreted to mean that in late November 1888, the perceived probability of any impending subsequent murder occurring within this elliptical region, should have been 72.32%.

                          ** My Geographic Profile Model would suggest a 38.18% perceptual probability that the perpetrator(s) of these crimes operated from a base that was situated within the specified elliptical region, i.e. within 1.22 Standard Deviations of the murder-site Mean-Center (green dot).

                          ... but, I will continue to call upon its original manifestation, for the time being.

                          My model would suggest a perceptual probability¹ of 38.18% that 'Jack the Ripper' resided somewhere within the red color-shaded ellipse, during the latter months of 1888.

                          ¹ As we dealing with a retrospective 'probability', we must refer to it as being 'perceptual', as opposed to being 'actual'.

                          As for actual probability; there is a 100.00% probability that 'Jack the Ripper' resided where he resided, and a 0.00% probability that he resided anywhere else.

                          He resided where he resided!

                          But, we shouldn't be at all reluctant to perceive certain degrees of probability, with regard to just where that happened to be.

                          ~~~

                          Now, would any of the decrepit old farts out there, or any of the other know-it-alls that get a kick out of pooh-poohing the 'art' of geographic criminal profiling, care to challenge my contention that we should perceive a chance of at least 1-in-3 that 'Jack the Ripper' resided somewhere within the above color-shaded elliptical region, having an area of 0.53 square-miles?

                          Anyone?

                          Comment


                          • #14
                            Originally posted by Heinrich View Post
                            What color would 24 New Street, Bishopsgate be on this map, I wonder.
                            Originally posted by Prosector View Post
                            I thought that smart serial killers tend to live outside or at the periphery of their area of operation, not at the epicentre (Peter Sutcliffe for example). Also, am I missing something but why does Elizabeth Stride not seem to be influencing the distribution of the isopleths on this map?
                            Please bear in mind, the fact that this probability distribution ...


                            Hypothetical Probability Distribution (Elliptical) (Click Image, to Enlarge in flickr)
                            Underlying Aerial Imagery: Copyright Google Earth, 2010
                            Overlying Plots, Labels and Color-Shadings: Copyright Colin C. Roberts, 2011

                            ... is hypothetical.

                            This distribution, on the other hand, ...


                            Cumulative Probability Distribution: Murder-Site Mean-Center, to Extent of Greatest Deviation, i.e. Mary Ann Nichols Murder-Site (Elliptical) (Click Image, to Enlarge in flickr)
                            Underlying Aerial Imagery: Copyright Google Earth, 2007
                            Overlying Plots, Labels and Color-Shadings: Copyright Colin C. Roberts, 2009

                            ... - while in need of some revision - is based upon an actual statistical analysis of the manner, in which the six murder-sites under consideration are dispersed, in relation to the murder-site mean-center (green dot).

                            Originally posted by Prosector View Post
                            ... why does Elizabeth Stride not seem to be influencing the distribution of the isopleths on this map?
                            The Stride murder-site has not been assigned a reduced weighting, in either instance.

                            It simply happens to be somewhat of an 'outlier'. As does the Nichols murder-site.

                            Originally posted by Prosector View Post
                            I thought that smart serial killers tend to live outside or at the periphery of their area of operation, not at the epicentre (Peter Sutcliffe for example).
                            It is generally believed that a serial offender is most likely to be found residing within his area of operation.

                            However, in the case of 'Jack the Ripper', we are dealing with an unusually small 'killing field' that was easily traversable on foot, in 1888; as it continues to be, to this day.

                            Contrary to a widely held misconception, within the field of 'Ripperology', this set of circumstances actually accommodates a greater possibility that 'Jack the Ripper' resided outside of the observed parameters of his killing-field, during the latter months of 1888.

                            ~~~

                            An Off-Topic Note:

                            Originally posted by Prosector View Post
                            Forgive me if the answer to what I'm asking is already established and also if I'm posting in the wrong thread but this is my first post and there's an awful lot of material in these message boards to wade through. My question is, does anyone know for certain the exact location of the entrance to Dutfield's Yard? I have spent some time recently wandering around what was Berner Street and on the East side there is only one three storey building that looks as if it may date from the 1888 period. Although it looks quite similar to the one shown in the 1909 picture (the IWEC) and the contemporary artists impressions it clearly had another similar building standing on its left as you look at it which has now been demolished so it can't be. Also there are decorative courses of blue bricks set into the red which don't show up in the 1909 photograph. My best guess is that the IWEC must have been more or less where the North end of Basil House is now IF it was on the East side of the street. Can anyone enlighten me?
                            We all seem to have ignored your first Casebook post, which you made some thirty days ago.

                            I would have gladly answered such a simple question, had I seen the post.


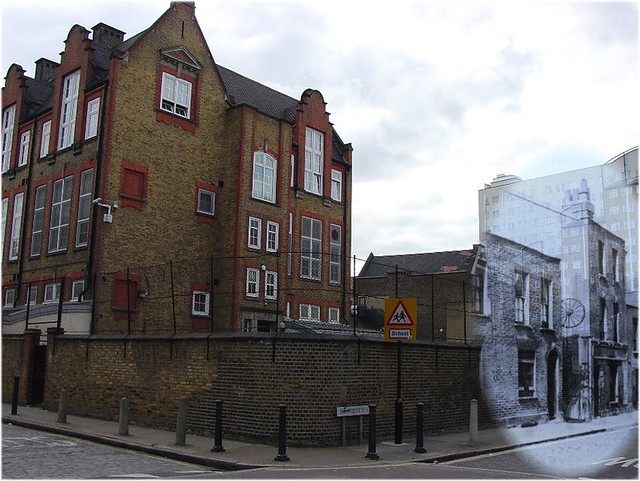
                            Northwestern Corner of Fairclough Street / Berner Street, Parish of St. George in the East (Click Image, to Enlarge in flickr)

                            Comment


                            • #15
                              Originally posted by Colin Roberts View Post
                              My Geographic Profile Model is undergoing a great deal of revision; ...


                              Cumulative Probability Distribution: Murder-Site Mean-Center, to Extent of Greatest Deviation, i.e. Mary Ann Nichols Murder-Site (Elliptical) (Click Image, to Enlarge in flickr)
                              Underlying Aerial Imagery: Copyright Google Earth, 2007
                              Overlying Plots, Labels and Color-Shadings: Copyright Colin C. Roberts, 2009

                              ...

                              ... but, I will continue to call upon its original manifestation, for the time being.

                              My model would suggest a perceptual probability¹ of 38.18% that 'Jack the Ripper' resided somewhere within the red color-shaded ellipse, during the latter months of 1888.

                              ¹ As we dealing with a retrospective 'probability', we must refer to it as being 'perceptual', as opposed to being 'actual'.

                              As for actual probability; there is a 100.00% probability that 'Jack the Ripper' resided where he resided, and a 0.00% probability that he resided anywhere else.

                              He resided where he resided!

                              But, we shouldn't be at all reluctant to perceive certain degrees of probability, with regard to just where that happened to be.

                              ~~~

                              Now, would any of the decrepit old farts out there, or any of the other know-it-alls that get a kick out of pooh-poohing the 'art' of geographic criminal profiling, care to challenge my contention that we should perceive a chance of at least 1-in-3 that 'Jack the Ripper' resided somewhere within the above color-shaded elliptical region, having an area of 0.53 square-miles?

                              Anyone?
                              Anyone?


                              Hello?

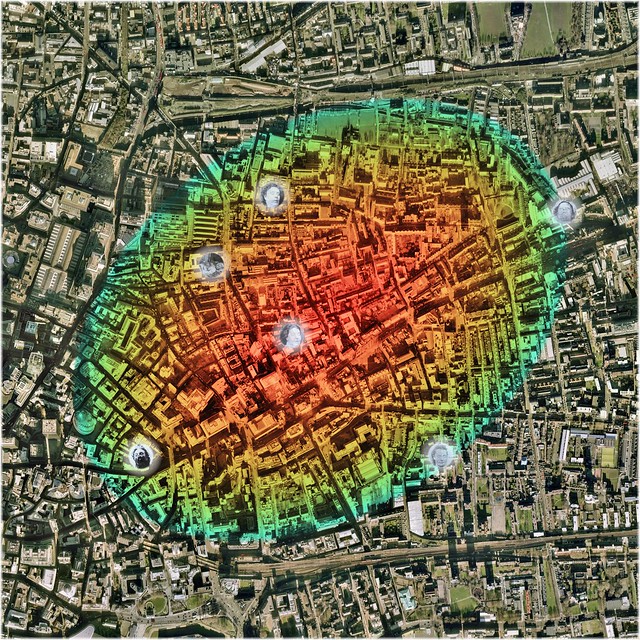
                              Here's another depiction of the same probability distribution.


                              Cumulative Probability Distribution: Murder-Site Mean-Center, to Extent of Greatest Deviation, i.e. Mary Ann Nichols Murder-Site (Elliptical) (Click Image, to Enlarge in flickr)
                              Underlying Aerial Imagery: Copyright Google Earth, 2007
                              Overlying Plots, Labels and Color-Shadings: Copyright Colin C. Roberts, 2011

                              As is the case in the first depiction, an elliptical color-shaded isopleth is covering the region, within which an accumulation of 38.18% of the overall distribution is contained.

                              As is not the case in the first depiction, however, the color-shading entails a blended semi-spectral progression, from red to cyan, i.e. from 0˚ to 180˚, of the isopleth's hue; ... as opposed to a desaturation progression of the isopleth's chosen color, i.e. red.

                              The blended semi-spectral progression of the isopleth's hue, in this instance, creates the effect of a 'cooling' progression, from red, i.e. relatively 'hot', to cyan, i.e. relatively 'cold'. This effect lends itself to the use of the term 'heat map', in describing this sort of depiction.

                              Each of the two images, is intended to depict a desaturation progression of the overall probability distribution's density, within a single interval of distribution accumulation, i.e. 0.00% -to- 38.18%.

                              In other words, each of the two images is intended to depict an elliptical isopleth that covers the smallest region, within which 38.18 percentage points of the overall distribution of probability can be accumulated; that being a region, within which the density of the accumulation is greatest at its center (red), ... and least at its periphery (cyan).

                              The latter of the two images, however, is probably the better depiction of that particular quality of the given accumulation of the overall distribution of probability: i.e. that the density of the accumulation is greatest at its center (red), ... and least at its periphery (cyan).

                              ~~~

                              In any case, the original (unrevised) manifestation of my Geographic Profile Model would suggest that we should perceive a probability of 38.18% that 'Jack the Ripper' resided somewhere within the above color-shaded elliptical region, during the latter months of 1888; ... an inherent implication being that within the limitations of this degree of perceptual probability, i.e. 38.18%, we should consider the center of the elliptical region to have been the 'most likely' place of residence, whilst considering its periphery to have been the 'least likely'.

                              ~~~

                              There are quite a few posters out there that get a kick out of pooh-poohing the 'art' of criminal profiling.

                              I have read numerous assertions to the effect 'profiling is nonsense', as well as a multitude of proclamations to the effect 'I don't believe in profiling'.

                              So, again, ...

                              Would anyone care to challenge my contention that we should perceive a chance of at least 1-in-3 that 'Jack the Ripper' resided somewhere - during the latter months of 1888 - within the above color-shaded elliptical region, having an area of 0.53 square-miles?

                              Anyone?

                              Comment

                              Working...
                              X