

Originally posted by RipperNoob
View Post
Oh, well!
~~~
The first two, of the following three images, have been 'improved', so I believe, in as much as the color-intensity of each of the respective isopleths, has been progressively diminished, in conjunction with the spectral progression that dictates its hue; i.e. in conjunction with the outward progression, from red, to orange, to yellow, etc.
This 'improvement' is intended to emphasize the fact that the density of the applicable geographic-profile probability distribution, itself, progressively diminishes, in conjunction with that spectral progression.
The third, of the following three images, is a 'new release'.
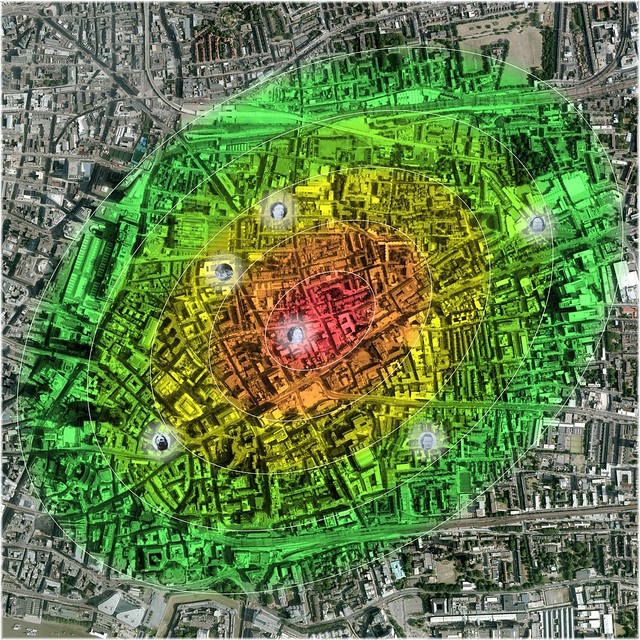
Accumulation of Probability Distribution (Elliptical): Murder-Site Mean-Center, to Extent of Fifty Percent Accumulation (Click Image, to Enlarge in flickr)
Underlying Aerial Imagery: Copyright Google Earth, 2010
Overlying Plots, Labels and Color-Shadings: Copyright Colin C. Roberts, 2011
50.00% Accumulation of Probability Distribution
The original (unrevised) manifestation of my Geographic Profile Model would suggest a perceptual probability� of 50.00% that 'Jack the Ripper' resided somewhere within the above color-shaded elliptical region, during the latter months of 1888.
In other words, it would suggest that we should perceive a chance of as much as 1-in-2 that 'Jack the Ripper' resided somewhere - during the latter months of 1888 - within the above color-shaded elliptical region, having an area of 1.00 square-miles.
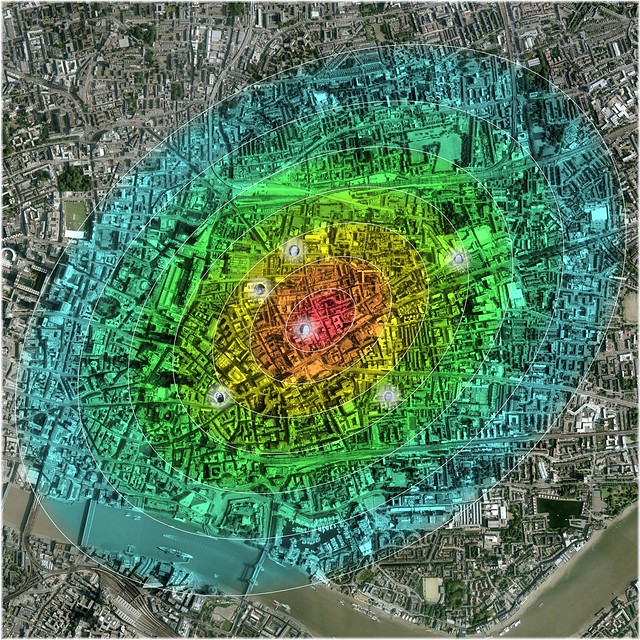
Accumulation of Probability Distribution (Elliptical): Murder-Site Mean-Center, to Extent of Seventy Percent Accumulation (Click Image, to Enlarge in flickr)
Underlying Aerial Imagery: Copyright Google Earth, 2010
Overlying Plots, Labels and Color-Shadings: Copyright Colin C. Roberts, 2011
70.00% Accumulation of Probability Distribution
The original (unrevised) manifestation of my Geographic Profile Model would suggest a perceptual probability� of 70.00% that 'Jack the Ripper' resided somewhere within the above color-shaded elliptical region, during the latter months of 1888.
In other words, it would suggest that we should perceive a chance of at least 2-in-3 that 'Jack the Ripper' resided somewhere - during the latter months of 1888 - within the above color-shaded elliptical region, having an area of 2.54 square-miles.

Accumulation of Probability Distribution (Elliptical): Murder-Site Mean-Center, to Extent of Ninety Percent Accumulation (Click Image, to Enlarge in flickr)
Underlying Aerial Imagery: Copyright Google Earth, 2010
Overlying Plots, Labels and Color-Shadings: Copyright Colin C. Roberts, 2011
90.00% Accumulation of Probability Distribution
The original (unrevised) manifestation of my Geographic Profile Model would suggest a perceptual probability� of 90.00% that 'Jack the Ripper' resided somewhere within the above color-shaded elliptical region, during the latter months of 1888.
In other words, it would suggest that we should perceive a chance of as much as 9-in-10 that 'Jack the Ripper' resided somewhere - during the latter months of 1888 - within the above color-shaded elliptical region, having an area of 7.72 square-miles.
� As we are dealing with a retrospective probability, we must refer to it as being 'perceptual', as opposed to being 'actual': The reason being that there is an actual probability of 100.00% that 'Jack of Ripper' resided wherever he did, during the latter months of 1888; as well as an actual probability of 0.00% that he resided anywhere else, during the same.
~~~
Red (i.e. Area within the Inner-Most Contour): Accumulation of Probability Distribution (Elliptical), from Murder-Site Mean-Center, to Extent of 10.00% Accumulation
- Standard Deviations from Murder-Site Mean-Center (Elliptical): 0.30
- Semi-Major Axis: 214.97 Yards
- Semi-Minor Axis: 152.48 Yards
- Area: 0.03 Square-Miles
- Accumulation of Probability Distribution: 10 Percentage Points
- Distribution Density: 300.81 Percentage Points per Square-Mile
Red/Orange (i.e. Total Area within the Two Inner-Most Contours): Accumulation of Probability Distribution (Elliptical), from Murder-Site Mean-Center, to Extent of 20.00% Accumulation
- Standard Deviations from Murder-Site Mean-Center (Elliptical): 0.61
- Semi-Major Axis: 434.50 Yards
- Semi-Minor Axis: 308.18 Yards
- Area: 0.14 Square-Miles
- Accumulation of Probability Distribution: 20 Percentage Points
- Distribution Density: 147.27 Percentage Points per Square-Mile
Red/Orange/Yellow (i.e. Total Area within the Three Inner-Most Contours): Accumulation of Probability Distribution (Elliptical), from Murder-Site Mean-Center, to Extent of 30.00% Accumulation
- Standard Deviations from Murder-Site Mean-Center (Elliptical): 0.94
- Semi-Major Axis: 663.79 Yards
- Semi-Minor Axis: 470.81 Yards
- Area: 0.32 Square-Miles
- Accumulation of Probability Distribution: 30 Percentage Points
- Distribution Density: 94.65 Percentage Points per Square-Mile
Red/Orange/Yellow/Yellow-Green (i.e. Total Area within the Four Inner-Most Contours): Accumulation of Probability Distribution (Elliptical), from Murder-Site Mean-Center, to Extent of 40.00% Accumulation
- Standard Deviations from Murder-Site Mean-Center (Elliptical): 1.29
- Semi-Major Axis: 909.66 Yards
- Semi-Minor Axis: 645.20 Yards
- Area: 0.60 Square-Miles
- Accumulation of Probability Distribution: 40 Percentage Points
- Distribution Density: 67.20 Percentage Points per Square-Mile
Red/Orange/Yellow/Yellow-Green/Lime-Green (i.e. Total Area within the Five Inner-Most Contours): Accumulation of Probability Distribution (Elliptical), from Murder-Site Mean-Center, to Extent of 50.00% Accumulation
- Standard Deviations from Murder-Site Mean-Center (Elliptical): 1.67
- Semi-Major Axis: 1,181.71 Yards
- Semi-Minor Axis: 838.16 Yards
- Area: 1.00 Square-Miles
- Accumulation of Probability Distribution: 50 Percentage Points
- Distribution Density: 49.77 Percentage Points per Square-Mile
Red/Orange/Yellow/Yellow-Green/Lime-Green/Green (i.e. Total Area within the Six Inner-Most Contours): Accumulation of Probability Distribution (Elliptical), from Murder-Site Mean-Center, to Extent of 60.00% Accumulation
- Standard Deviations from Murder-Site Mean-Center (Elliptical): 2.11
- Semi-Major Axis: 1,495.22 Yards
- Semi-Minor Axis: 1,060.53 Yards
- Area: 1.61 Square-Miles
- Accumulation of Probability Distribution: 60 Percentage Points
- Distribution Density: 37.31 Percentage Points per Square-Mile
Red/Orange/Yellow/Yellow-Green/Lime-Green/Green/Aqua (i.e. Total Area within the Seven Inner-Most Contours): Accumulation of Probability Distribution (Elliptical), from Murder-Site Mean-Center, to Extent of 70.00% Accumulation
- Standard Deviations from Murder-Site Mean-Center (Elliptical): 2.66
- Semi-Major Axis: 1,879.80 Yards
- Semi-Minor Axis: 1,333.30 Yards
- Area: 2.54 Square-Miles
- Accumulation of Probability Distribution: 70 Percentage Points
- Distribution Density: 27.54 Percentage Points per Square-Mile
Red/Orange/Yellow/Yellow-Green/Lime-Green/Green/Aqua/Blue (i.e. Total Area within the Eight Inner-Most Contours): Accumulation of Probability Distribution (Elliptical), from Murder-Site Mean-Center, to Extent of 80.00% Accumulation
- Standard Deviations from Murder-Site Mean-Center (Elliptical): 3.39
- Semi-Major Axis: 2,400.16 Yards
- Semi-Minor Axis: 1,702.38 Yards
- Area: 4.14 Square-Miles
- Accumulation of Probability Distribution: 80 Percentage Points
- Distribution Density: 19.30 Percentage Points per Square-Mile
Red/Orange/Yellow/Yellow-Green/Lime-Green/Green/Aqua/Blue/Indigo (i.e. Total Area within the Nine Contours): Accumulation of Probability Distribution (Elliptical), from Murder-Site Mean-Center, to Extent of 90.00% Accumulation
- Standard Deviations from Murder-Site Mean-Center (Elliptical): 4.63
- Semi-Major Axis: 3,276.65 Yards
- Semi-Minor Axis: 2,324.06 Yards
- Area: 7.72 Square-Miles
- Accumulation of Probability Distribution: 90 Percentage Points
- Distribution Density: 11.65 Percentage Points per Square-Mile
In this instance, the blended spectral progression, from red to indigo, i.e. from 0˚ to 240˚, of the color-shaded elliptical region's hue is measured as follows:
Red, i.e. 0˚
- Distribution Accumulation: 0.00% - 10.00%
Orange, i.e. 30˚
- Distribution Accumulation: 10.00% - 20.00%
Yellow, i.e. 60˚
- Distribution Accumulation: 20.00% - 30.00%
Yellow-Green, i.e. 90˚
- Distribution Accumulation: 30.00% - 40.00%
Lime-Green, i.e. 120˚
- Distribution Accumulation: 40.00% - 50.00%
Green, i.e. 150˚
- Distribution Accumulation: 50.00% - 60.00%
Aqua, i.e. 180˚
- Distribution Accumulation: 60.00% - 70.00%
Blue, i.e. 210˚
- Distribution Accumulation: 70.00% - 80.00%
Indigo, i.e. 240˚
- Distribution Accumulation: 80.00% - 90.00%
As the spectral progression is blended, each of the ten-percentage-point intervals of distribution accumulation is defined by an elliptical white contour that facilitates the depiction of the respective interval, as a distinct isopleth.
~~~
Originally posted by Rubyretro
View Post
~~~
Originally posted by caz
View Post
Originally posted by caz
View Post
Originally posted by curious
View Post
And, ...
Originally posted by Colin Roberts
View Post


 In Practical Terms:


Leave a comment: