

From the thread entitled "Laura Richards knows who the ripper was":
Originally posted by Colin Roberts
View Post
From the initial post of the thread entitled "Where did the Ripper likely live?":
I don't mind admitting that it is extremely disheartening to see that thread degenerating, as it has, - over the course of the most recent two-week period, and through the duration of its 112 posts - into a discussion regarding whether Catherine Eddowes was soliciting when she met her demise, without so much as a mention - from anyone - of the analysis that I have been presenting, in this thread.
Oh, well!
~~~
The first two, of the following three images, have been 'improved', so I believe, in as much as the color-intensity of each of the respective isopleths, has been progressively diminished, in conjunction with the spectral progression that dictates its hue; i.e. in conjunction with the outward progression, from red, to orange, to yellow, etc.
This 'improvement' is intended to emphasize the fact that the density of the applicable geographic-profile probability distribution, itself, progressively diminishes, in conjunction with that spectral progression.
The third, of the following three images, is a 'new release'.
Accumulation of Probability Distribution (Elliptical): Murder-Site Mean-Center, to Extent of Fifty Percent Accumulation (Click Image, to Enlarge in flickr)
Underlying Aerial Imagery: Copyright Google Earth, 2010
Overlying Plots, Labels and Color-Shadings: Copyright Colin C. Roberts, 2011
50.00% Accumulation of Probability Distribution
The original (unrevised) manifestation of my Geographic Profile Model would suggest a perceptual probability� of 50.00% that 'Jack the Ripper' resided somewhere within the above color-shaded elliptical region, during the latter months of 1888.
In other words, it would suggest that we should perceive a chance of as much as 1-in-2 that 'Jack the Ripper' resided somewhere - during the latter months of 1888 - within the above color-shaded elliptical region, having an area of 1.00 square-miles.
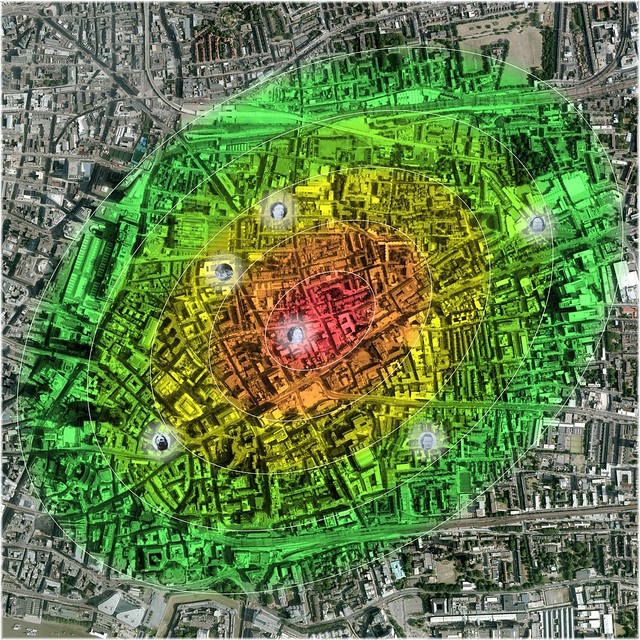
Accumulation of Probability Distribution (Elliptical): Murder-Site Mean-Center, to Extent of Seventy Percent Accumulation (Click Image, to Enlarge in flickr)
Underlying Aerial Imagery: Copyright Google Earth, 2010
Overlying Plots, Labels and Color-Shadings: Copyright Colin C. Roberts, 2011
70.00% Accumulation of Probability Distribution
The original (unrevised) manifestation of my Geographic Profile Model would suggest a perceptual probability� of 70.00% that 'Jack the Ripper' resided somewhere within the above color-shaded elliptical region, during the latter months of 1888.
In other words, it would suggest that we should perceive a chance of at least 2-in-3 that 'Jack the Ripper' resided somewhere - during the latter months of 1888 - within the above color-shaded elliptical region, having an area of 2.54 square-miles.

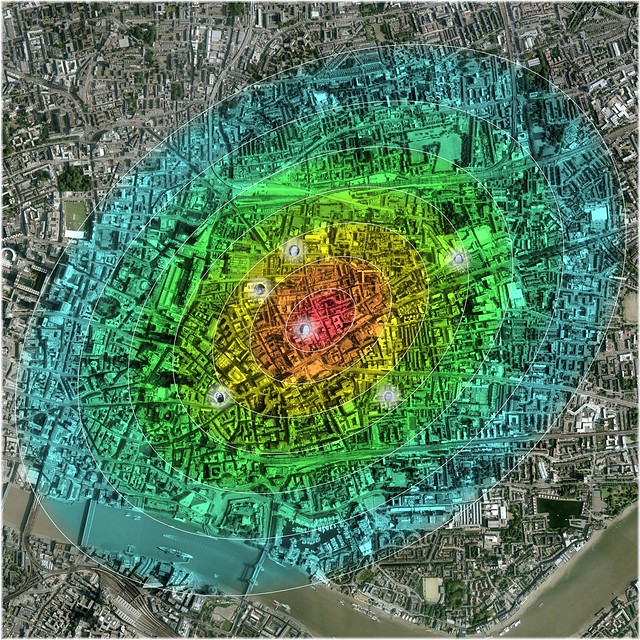
Accumulation of Probability Distribution (Elliptical): Murder-Site Mean-Center, to Extent of Ninety Percent Accumulation (Click Image, to Enlarge in flickr)
Underlying Aerial Imagery: Copyright Google Earth, 2010
Overlying Plots, Labels and Color-Shadings: Copyright Colin C. Roberts, 2011
90.00% Accumulation of Probability Distribution
The original (unrevised) manifestation of my Geographic Profile Model would suggest a perceptual probability� of 90.00% that 'Jack the Ripper' resided somewhere within the above color-shaded elliptical region, during the latter months of 1888.
In other words, it would suggest that we should perceive a chance of as much as 9-in-10 that 'Jack the Ripper' resided somewhere - during the latter months of 1888 - within the above color-shaded elliptical region, having an area of 7.72 square-miles.
� As we are dealing with a retrospective probability, we must refer to it as being 'perceptual', as opposed to being 'actual': The reason being that there is an actual probability of 100.00% that 'Jack of Ripper' resided wherever he did, during the latter months of 1888; as well as an actual probability of 0.00% that he resided anywhere else, during the same.
~~~
Red (i.e. Area within the Inner-Most Contour): Accumulation of Probability Distribution (Elliptical), from Murder-Site Mean-Center, to Extent of 10.00% Accumulation
- Standard Deviations from Murder-Site Mean-Center (Elliptical): 0.30
- Semi-Major Axis: 214.97 Yards
- Semi-Minor Axis: 152.48 Yards
- Area: 0.03 Square-Miles
- Accumulation of Probability Distribution: 10 Percentage Points
- Distribution Density: 300.81 Percentage Points per Square-Mile
Red/Orange (i.e. Total Area within the Two Inner-Most Contours): Accumulation of Probability Distribution (Elliptical), from Murder-Site Mean-Center, to Extent of 20.00% Accumulation
- Standard Deviations from Murder-Site Mean-Center (Elliptical): 0.61
- Semi-Major Axis: 434.50 Yards
- Semi-Minor Axis: 308.18 Yards
- Area: 0.14 Square-Miles
- Accumulation of Probability Distribution: 20 Percentage Points
- Distribution Density: 147.27 Percentage Points per Square-Mile
Red/Orange/Yellow (i.e. Total Area within the Three Inner-Most Contours): Accumulation of Probability Distribution (Elliptical), from Murder-Site Mean-Center, to Extent of 30.00% Accumulation
- Standard Deviations from Murder-Site Mean-Center (Elliptical): 0.94
- Semi-Major Axis: 663.79 Yards
- Semi-Minor Axis: 470.81 Yards
- Area: 0.32 Square-Miles
- Accumulation of Probability Distribution: 30 Percentage Points
- Distribution Density: 94.65 Percentage Points per Square-Mile
Red/Orange/Yellow/Yellow-Green (i.e. Total Area within the Four Inner-Most Contours): Accumulation of Probability Distribution (Elliptical), from Murder-Site Mean-Center, to Extent of 40.00% Accumulation
- Standard Deviations from Murder-Site Mean-Center (Elliptical): 1.29
- Semi-Major Axis: 909.66 Yards
- Semi-Minor Axis: 645.20 Yards
- Area: 0.60 Square-Miles
- Accumulation of Probability Distribution: 40 Percentage Points
- Distribution Density: 67.20 Percentage Points per Square-Mile
Red/Orange/Yellow/Yellow-Green/Lime-Green (i.e. Total Area within the Five Inner-Most Contours): Accumulation of Probability Distribution (Elliptical), from Murder-Site Mean-Center, to Extent of 50.00% Accumulation
- Standard Deviations from Murder-Site Mean-Center (Elliptical): 1.67
- Semi-Major Axis: 1,181.71 Yards
- Semi-Minor Axis: 838.16 Yards
- Area: 1.00 Square-Miles
- Accumulation of Probability Distribution: 50 Percentage Points
- Distribution Density: 49.77 Percentage Points per Square-Mile
Red/Orange/Yellow/Yellow-Green/Lime-Green/Green (i.e. Total Area within the Six Inner-Most Contours): Accumulation of Probability Distribution (Elliptical), from Murder-Site Mean-Center, to Extent of 60.00% Accumulation
- Standard Deviations from Murder-Site Mean-Center (Elliptical): 2.11
- Semi-Major Axis: 1,495.22 Yards
- Semi-Minor Axis: 1,060.53 Yards
- Area: 1.61 Square-Miles
- Accumulation of Probability Distribution: 60 Percentage Points
- Distribution Density: 37.31 Percentage Points per Square-Mile
Red/Orange/Yellow/Yellow-Green/Lime-Green/Green/Aqua (i.e. Total Area within the Seven Inner-Most Contours): Accumulation of Probability Distribution (Elliptical), from Murder-Site Mean-Center, to Extent of 70.00% Accumulation
- Standard Deviations from Murder-Site Mean-Center (Elliptical): 2.66
- Semi-Major Axis: 1,879.80 Yards
- Semi-Minor Axis: 1,333.30 Yards
- Area: 2.54 Square-Miles
- Accumulation of Probability Distribution: 70 Percentage Points
- Distribution Density: 27.54 Percentage Points per Square-Mile
Red/Orange/Yellow/Yellow-Green/Lime-Green/Green/Aqua/Blue (i.e. Total Area within the Eight Inner-Most Contours): Accumulation of Probability Distribution (Elliptical), from Murder-Site Mean-Center, to Extent of 80.00% Accumulation
- Standard Deviations from Murder-Site Mean-Center (Elliptical): 3.39
- Semi-Major Axis: 2,400.16 Yards
- Semi-Minor Axis: 1,702.38 Yards
- Area: 4.14 Square-Miles
- Accumulation of Probability Distribution: 80 Percentage Points
- Distribution Density: 19.30 Percentage Points per Square-Mile
Red/Orange/Yellow/Yellow-Green/Lime-Green/Green/Aqua/Blue/Indigo (i.e. Total Area within the Nine Contours): Accumulation of Probability Distribution (Elliptical), from Murder-Site Mean-Center, to Extent of 90.00% Accumulation
- Standard Deviations from Murder-Site Mean-Center (Elliptical): 4.63
- Semi-Major Axis: 3,276.65 Yards
- Semi-Minor Axis: 2,324.06 Yards
- Area: 7.72 Square-Miles
- Accumulation of Probability Distribution: 90 Percentage Points
- Distribution Density: 11.65 Percentage Points per Square-Mile
In this instance, the blended spectral progression, from red to indigo, i.e. from 0˚ to 240˚, of the color-shaded elliptical region's hue is measured as follows:
Red, i.e. 0˚
- Distribution Accumulation: 0.00% - 10.00%
Orange, i.e. 30˚
- Distribution Accumulation: 10.00% - 20.00%
Yellow, i.e. 60˚
- Distribution Accumulation: 20.00% - 30.00%
Yellow-Green, i.e. 90˚
- Distribution Accumulation: 30.00% - 40.00%
Lime-Green, i.e. 120˚
- Distribution Accumulation: 40.00% - 50.00%
Green, i.e. 150˚
- Distribution Accumulation: 50.00% - 60.00%
Aqua, i.e. 180˚
- Distribution Accumulation: 60.00% - 70.00%
Blue, i.e. 210˚
- Distribution Accumulation: 70.00% - 80.00%
Indigo, i.e. 240˚
- Distribution Accumulation: 80.00% - 90.00%
As the spectral progression is blended, each of the ten-percentage-point intervals of distribution accumulation is defined by an elliptical white contour that facilitates the depiction of the respective interval, as a distinct isopleth.
Originally posted by RipperNoob
View Post
..., something I've read often is that the Ripper was likely local to Whitechapel, that his being able to escape from the crime scenes so swiftly and without being noticed or captured lends to at least a working knowledge of the streets of Whitechapel and the alleys. The fact that the crimes--the canonical five anyway, along with Tabram--happened in a rather close proximity suggests that Whitechapel was where the killer lived.
Do any of you agree that he was probably a local to Whitechapel? If so, have any of you ever proposed where he might've lived, what street?
Do any of you agree that he was probably a local to Whitechapel? If so, have any of you ever proposed where he might've lived, what street?
Oh, well!
~~~
The first two, of the following three images, have been 'improved', so I believe, in as much as the color-intensity of each of the respective isopleths, has been progressively diminished, in conjunction with the spectral progression that dictates its hue; i.e. in conjunction with the outward progression, from red, to orange, to yellow, etc.
This 'improvement' is intended to emphasize the fact that the density of the applicable geographic-profile probability distribution, itself, progressively diminishes, in conjunction with that spectral progression.
The third, of the following three images, is a 'new release'.
Accumulation of Probability Distribution (Elliptical): Murder-Site Mean-Center, to Extent of Fifty Percent Accumulation (Click Image, to Enlarge in flickr)
Underlying Aerial Imagery: Copyright Google Earth, 2010
Overlying Plots, Labels and Color-Shadings: Copyright Colin C. Roberts, 2011
50.00% Accumulation of Probability Distribution
The original (unrevised) manifestation of my Geographic Profile Model would suggest a perceptual probability� of 50.00% that 'Jack the Ripper' resided somewhere within the above color-shaded elliptical region, during the latter months of 1888.
In other words, it would suggest that we should perceive a chance of as much as 1-in-2 that 'Jack the Ripper' resided somewhere - during the latter months of 1888 - within the above color-shaded elliptical region, having an area of 1.00 square-miles.
Accumulation of Probability Distribution (Elliptical): Murder-Site Mean-Center, to Extent of Seventy Percent Accumulation (Click Image, to Enlarge in flickr)
Underlying Aerial Imagery: Copyright Google Earth, 2010
Overlying Plots, Labels and Color-Shadings: Copyright Colin C. Roberts, 2011
70.00% Accumulation of Probability Distribution
The original (unrevised) manifestation of my Geographic Profile Model would suggest a perceptual probability� of 70.00% that 'Jack the Ripper' resided somewhere within the above color-shaded elliptical region, during the latter months of 1888.
In other words, it would suggest that we should perceive a chance of at least 2-in-3 that 'Jack the Ripper' resided somewhere - during the latter months of 1888 - within the above color-shaded elliptical region, having an area of 2.54 square-miles.
Accumulation of Probability Distribution (Elliptical): Murder-Site Mean-Center, to Extent of Ninety Percent Accumulation (Click Image, to Enlarge in flickr)
Underlying Aerial Imagery: Copyright Google Earth, 2010
Overlying Plots, Labels and Color-Shadings: Copyright Colin C. Roberts, 2011
90.00% Accumulation of Probability Distribution
The original (unrevised) manifestation of my Geographic Profile Model would suggest a perceptual probability� of 90.00% that 'Jack the Ripper' resided somewhere within the above color-shaded elliptical region, during the latter months of 1888.
In other words, it would suggest that we should perceive a chance of as much as 9-in-10 that 'Jack the Ripper' resided somewhere - during the latter months of 1888 - within the above color-shaded elliptical region, having an area of 7.72 square-miles.
� As we are dealing with a retrospective probability, we must refer to it as being 'perceptual', as opposed to being 'actual': The reason being that there is an actual probability of 100.00% that 'Jack of Ripper' resided wherever he did, during the latter months of 1888; as well as an actual probability of 0.00% that he resided anywhere else, during the same.
~~~
Red (i.e. Area within the Inner-Most Contour): Accumulation of Probability Distribution (Elliptical), from Murder-Site Mean-Center, to Extent of 10.00% Accumulation
- Standard Deviations from Murder-Site Mean-Center (Elliptical): 0.30
- Semi-Major Axis: 214.97 Yards
- Semi-Minor Axis: 152.48 Yards
- Area: 0.03 Square-Miles
- Accumulation of Probability Distribution: 10 Percentage Points
- Distribution Density: 300.81 Percentage Points per Square-Mile
Red/Orange (i.e. Total Area within the Two Inner-Most Contours): Accumulation of Probability Distribution (Elliptical), from Murder-Site Mean-Center, to Extent of 20.00% Accumulation
- Standard Deviations from Murder-Site Mean-Center (Elliptical): 0.61
- Semi-Major Axis: 434.50 Yards
- Semi-Minor Axis: 308.18 Yards
- Area: 0.14 Square-Miles
- Accumulation of Probability Distribution: 20 Percentage Points
- Distribution Density: 147.27 Percentage Points per Square-Mile
Red/Orange/Yellow (i.e. Total Area within the Three Inner-Most Contours): Accumulation of Probability Distribution (Elliptical), from Murder-Site Mean-Center, to Extent of 30.00% Accumulation
- Standard Deviations from Murder-Site Mean-Center (Elliptical): 0.94
- Semi-Major Axis: 663.79 Yards
- Semi-Minor Axis: 470.81 Yards
- Area: 0.32 Square-Miles
- Accumulation of Probability Distribution: 30 Percentage Points
- Distribution Density: 94.65 Percentage Points per Square-Mile
Red/Orange/Yellow/Yellow-Green (i.e. Total Area within the Four Inner-Most Contours): Accumulation of Probability Distribution (Elliptical), from Murder-Site Mean-Center, to Extent of 40.00% Accumulation
- Standard Deviations from Murder-Site Mean-Center (Elliptical): 1.29
- Semi-Major Axis: 909.66 Yards
- Semi-Minor Axis: 645.20 Yards
- Area: 0.60 Square-Miles
- Accumulation of Probability Distribution: 40 Percentage Points
- Distribution Density: 67.20 Percentage Points per Square-Mile
Red/Orange/Yellow/Yellow-Green/Lime-Green (i.e. Total Area within the Five Inner-Most Contours): Accumulation of Probability Distribution (Elliptical), from Murder-Site Mean-Center, to Extent of 50.00% Accumulation
- Standard Deviations from Murder-Site Mean-Center (Elliptical): 1.67
- Semi-Major Axis: 1,181.71 Yards
- Semi-Minor Axis: 838.16 Yards
- Area: 1.00 Square-Miles
- Accumulation of Probability Distribution: 50 Percentage Points
- Distribution Density: 49.77 Percentage Points per Square-Mile
Red/Orange/Yellow/Yellow-Green/Lime-Green/Green (i.e. Total Area within the Six Inner-Most Contours): Accumulation of Probability Distribution (Elliptical), from Murder-Site Mean-Center, to Extent of 60.00% Accumulation
- Standard Deviations from Murder-Site Mean-Center (Elliptical): 2.11
- Semi-Major Axis: 1,495.22 Yards
- Semi-Minor Axis: 1,060.53 Yards
- Area: 1.61 Square-Miles
- Accumulation of Probability Distribution: 60 Percentage Points
- Distribution Density: 37.31 Percentage Points per Square-Mile
Red/Orange/Yellow/Yellow-Green/Lime-Green/Green/Aqua (i.e. Total Area within the Seven Inner-Most Contours): Accumulation of Probability Distribution (Elliptical), from Murder-Site Mean-Center, to Extent of 70.00% Accumulation
- Standard Deviations from Murder-Site Mean-Center (Elliptical): 2.66
- Semi-Major Axis: 1,879.80 Yards
- Semi-Minor Axis: 1,333.30 Yards
- Area: 2.54 Square-Miles
- Accumulation of Probability Distribution: 70 Percentage Points
- Distribution Density: 27.54 Percentage Points per Square-Mile
Red/Orange/Yellow/Yellow-Green/Lime-Green/Green/Aqua/Blue (i.e. Total Area within the Eight Inner-Most Contours): Accumulation of Probability Distribution (Elliptical), from Murder-Site Mean-Center, to Extent of 80.00% Accumulation
- Standard Deviations from Murder-Site Mean-Center (Elliptical): 3.39
- Semi-Major Axis: 2,400.16 Yards
- Semi-Minor Axis: 1,702.38 Yards
- Area: 4.14 Square-Miles
- Accumulation of Probability Distribution: 80 Percentage Points
- Distribution Density: 19.30 Percentage Points per Square-Mile
Red/Orange/Yellow/Yellow-Green/Lime-Green/Green/Aqua/Blue/Indigo (i.e. Total Area within the Nine Contours): Accumulation of Probability Distribution (Elliptical), from Murder-Site Mean-Center, to Extent of 90.00% Accumulation
- Standard Deviations from Murder-Site Mean-Center (Elliptical): 4.63
- Semi-Major Axis: 3,276.65 Yards
- Semi-Minor Axis: 2,324.06 Yards
- Area: 7.72 Square-Miles
- Accumulation of Probability Distribution: 90 Percentage Points
- Distribution Density: 11.65 Percentage Points per Square-Mile
In this instance, the blended spectral progression, from red to indigo, i.e. from 0˚ to 240˚, of the color-shaded elliptical region's hue is measured as follows:
Red, i.e. 0˚
- Distribution Accumulation: 0.00% - 10.00%
Orange, i.e. 30˚
- Distribution Accumulation: 10.00% - 20.00%
Yellow, i.e. 60˚
- Distribution Accumulation: 20.00% - 30.00%
Yellow-Green, i.e. 90˚
- Distribution Accumulation: 30.00% - 40.00%
Lime-Green, i.e. 120˚
- Distribution Accumulation: 40.00% - 50.00%
Green, i.e. 150˚
- Distribution Accumulation: 50.00% - 60.00%
Aqua, i.e. 180˚
- Distribution Accumulation: 60.00% - 70.00%
Blue, i.e. 210˚
- Distribution Accumulation: 70.00% - 80.00%
Indigo, i.e. 240˚
- Distribution Accumulation: 80.00% - 90.00%
As the spectral progression is blended, each of the ten-percentage-point intervals of distribution accumulation is defined by an elliptical white contour that facilitates the depiction of the respective interval, as a distinct isopleth.


Leave a comment: